
CLICK ON CHART TO ENLARGE
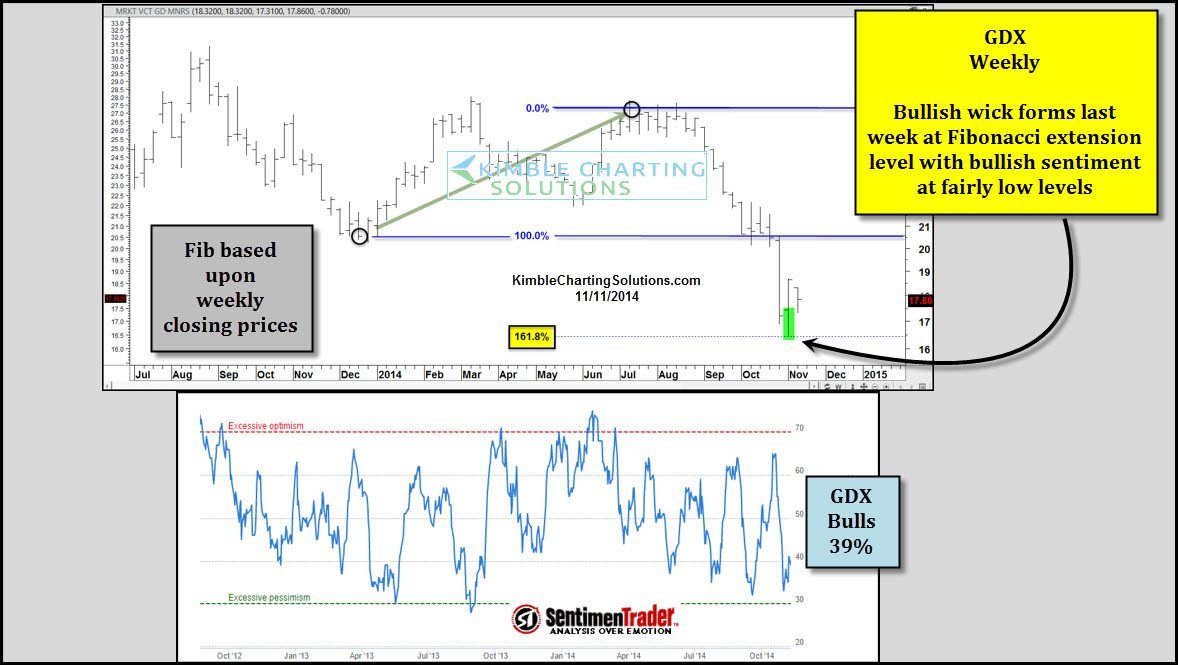
Gold Miners ETF GDX broke below the lows of almost a year ago (Dec 2013) and promptly lost nearly 20% of its value in less than two weeks.
This decline took it down to its Fibonacci 161% extension level (based upon the lows of a year ago and the highs this past summer).
The inset chart above from Sentiment Trader, reflects that 39% of investors are bullish GDX at this time.
Needing this ratio to head higher (see below)-
CLICK ON CHART TO ENLARGE
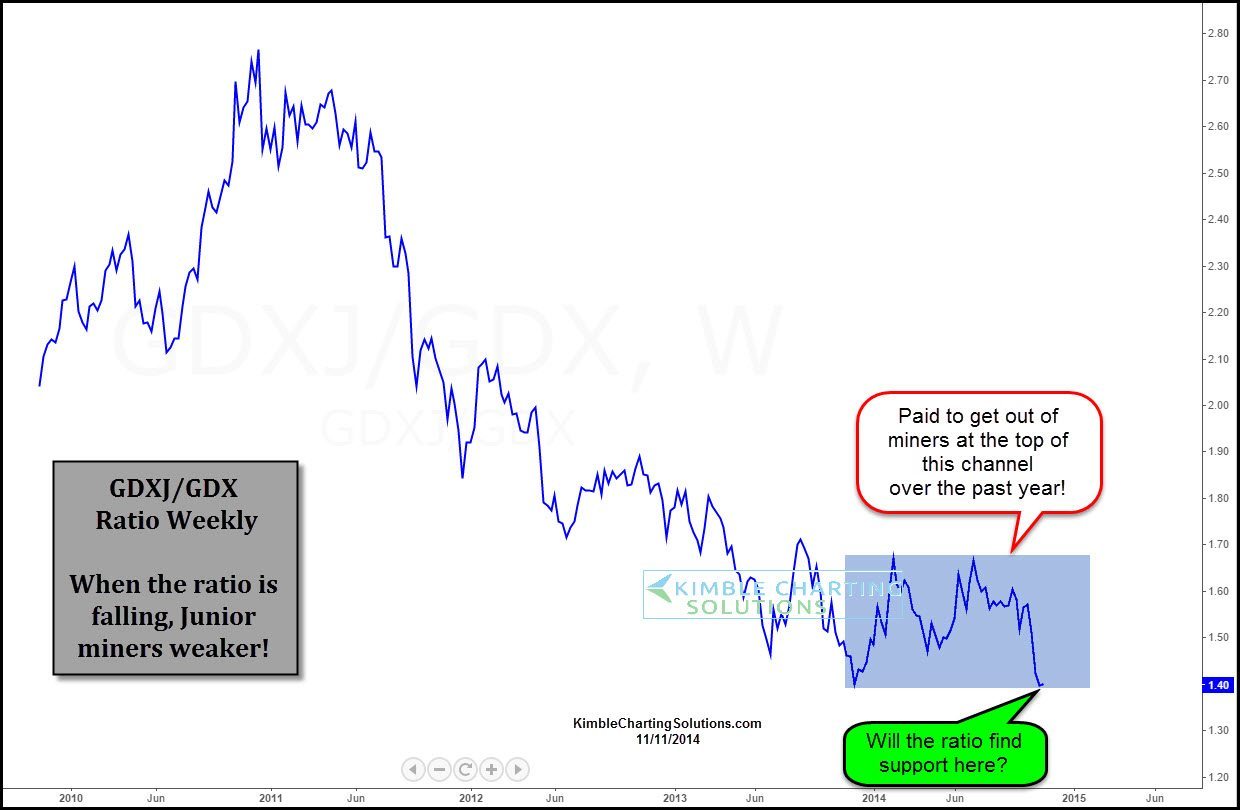
Quality rallies in the mining sector take place when Junior miners (GDXJ) are stronger than seniors. The ratio above reflects how weak the Juniors have been the past couple of years, sending an overall bearish message to this sector.
Could a double bottom be taking place in this ratio right now? Humbly, it could be yet I believe its too early to tell. I am watching the bullish wick in GDX and the level of this ratio very closely.
Premium & Metals Members took a position in this sector last week due to this ratio (see post here).
–
–
