
CLICK ON CHART TO ENLARGE
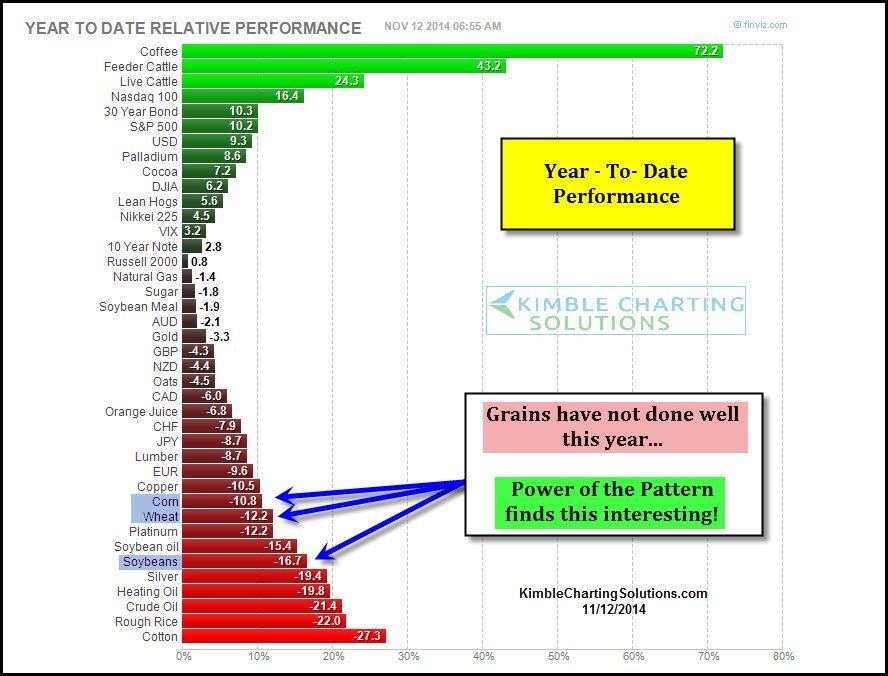
The table below reflects how Corn, Soybeans and Wheat has done year-to-date (not well, losing between 10% – 16%)! This type of poor performance often creates opportunities, if you like the ole boring idea of “buying low and selling higher!”
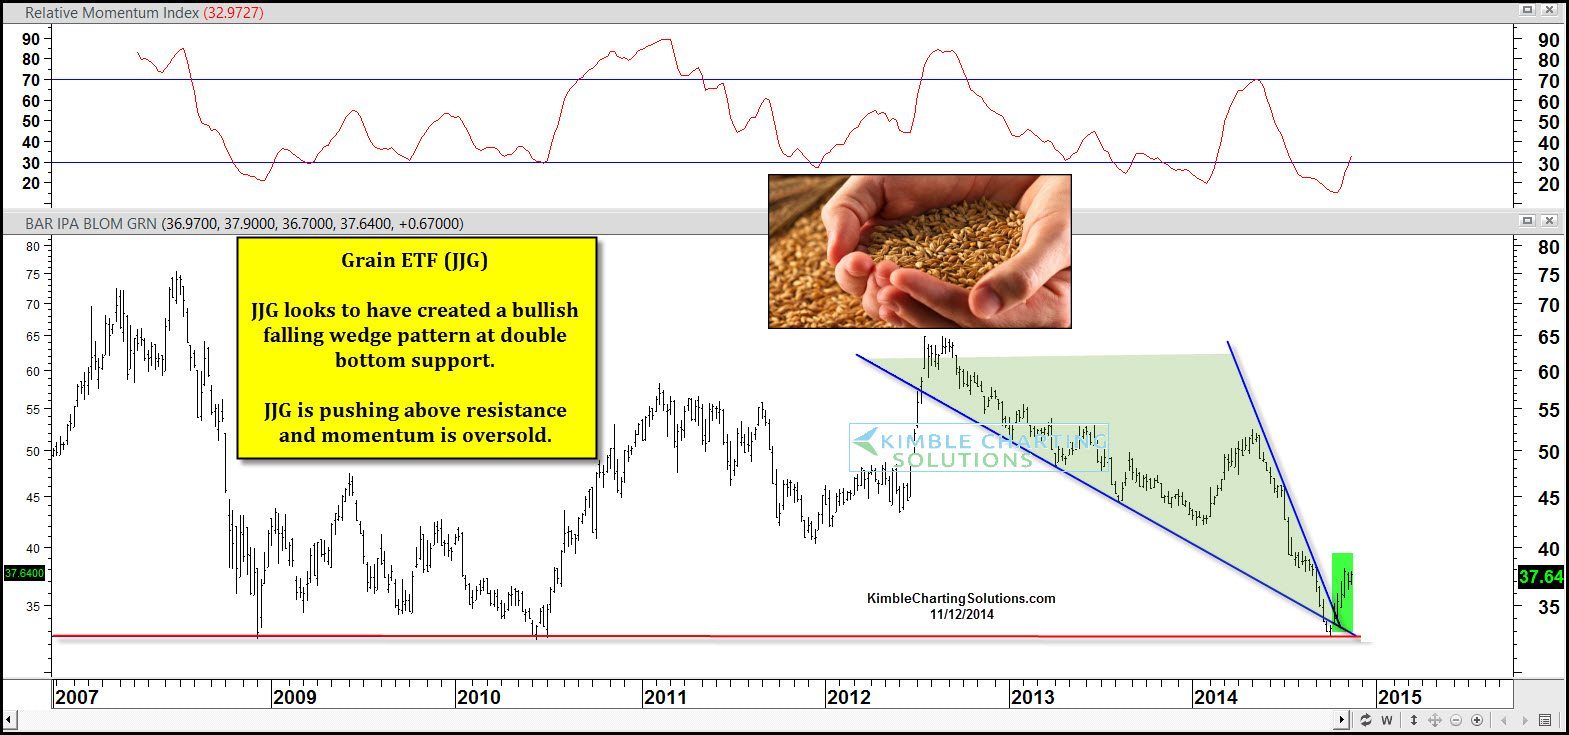
The above chart takes a look at the Grain ETF (JJG). The Power of the Patterns take on JJG is this – A bullish falling wedge seems to have formed, which suggests that 65% of the time a rally will take place. This bottom of the wedge formed at a potential triple bottom.
CLICK ON CHART TO ENLARGE
JJG of late appears to be breaking out to the upside of this bullish falling wedge. To no surprise, sentiment levels are very depressed in all three grains, with Soybeans having the fewest bulls of the three, just 28%.
Full Disclosure – Premium and Triple Play Members picked up JJG at the bottom of the wedge/triple support of late, with specific stops and risk management strategies in play based upon the patterns.
–
See our Products/Services at our new website…..
–
