CLICK ON CHART TO ENLARGE
When it comes to breakouts, let me make one thing clear, I like to buy them! How does one define a breakout? When it comes to technical analysis, breakouts are viewed from many different angles.
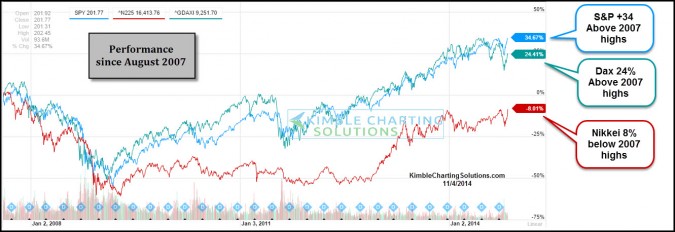
One simple view of a breakout is nothing fancier than looking at it this way….is an asset above an old high? Is the S&P 500 above old highs? Yes it is, (30% above its 2007 highs). Is the DAX Index (Germany) above old highs? Yes it is, (20% above its 2007 highs).
CLICK ON CHART TO ENLARGE
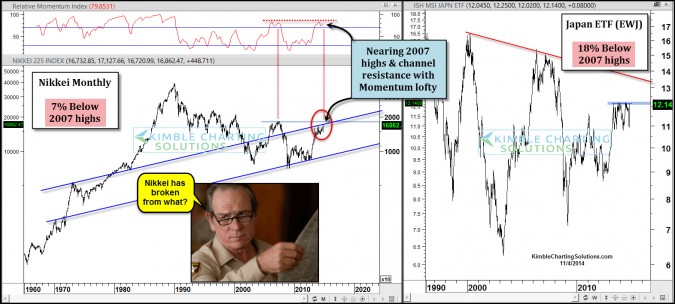
The Nikkei has been acting like a rocket ship of late, as its up 10% in the past 5-days! Where does this rally put the index, when comparing it to its 2007 highs? At this time the Nikkei 225 is around 7% below its old highs and the Japan ETF (EWJ) is lagging even more, as its around 18% below old highs.
As I shared earlier, I am totally in favor of buying breakouts. The Power of the Pattern would suggest that the 2007 highs are resistance that hasn’t been broke at this time. Also be aware that monthly momentum is lofty and the index is up against channel resistance at this time.
I like breakouts and will be a buyer if the Nikkei can prove to get above old highs and channel resistance!
–
Visit our new website…. Here


