
CLICK ON CHART TO ENLARGE
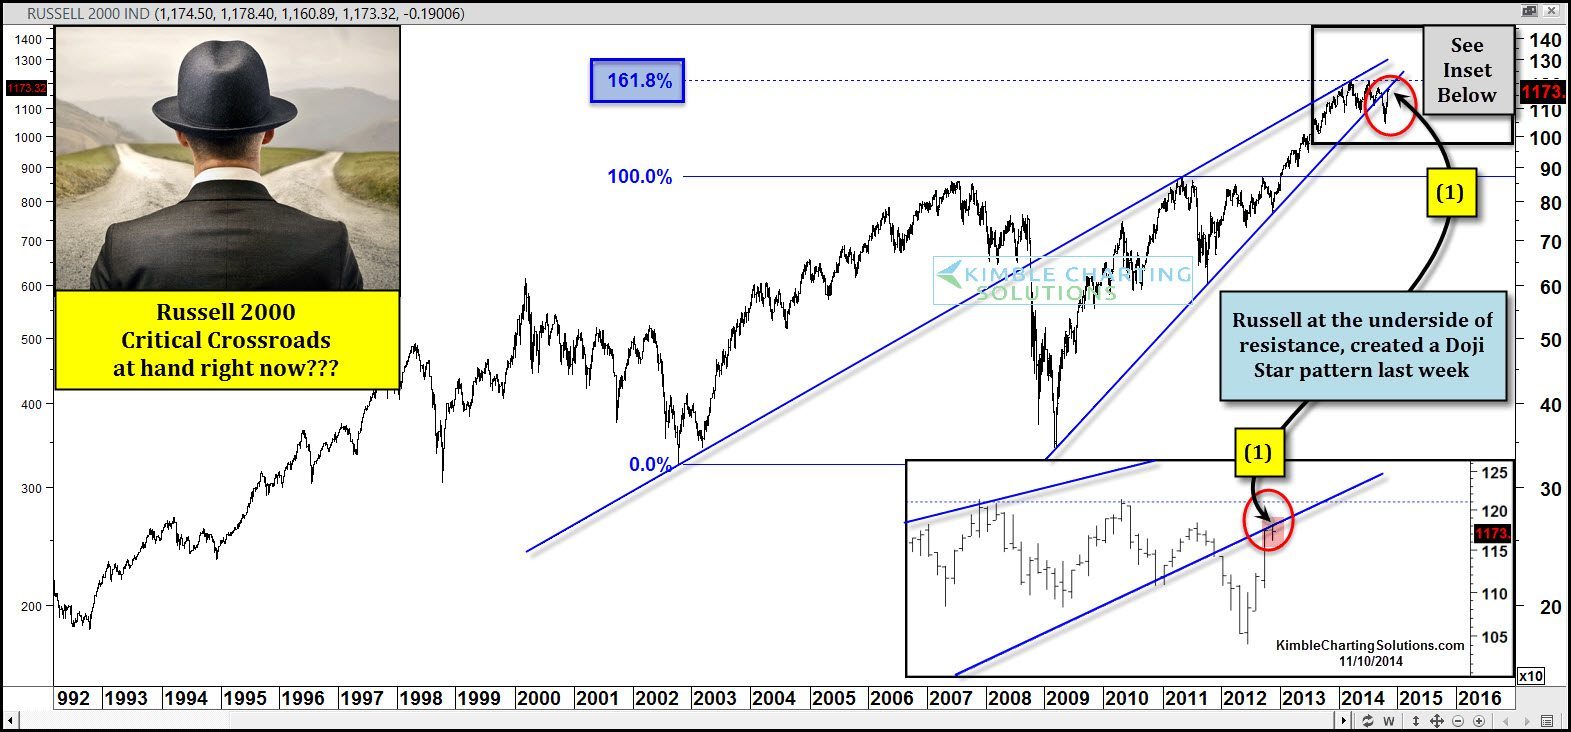
Don’t underestimate the importance of what the Russell 2000 does from here!
Almost a month ago, small caps found themselves very oversold, on support and poised for a rally. I shared why the Power of the Pattern thought they were poised for a rally in this post at See It Markets. (See Post Here) The day after this post, small caps started screaming higher, out performing the S&P by a large percentage. Well that is now the past.
Turning the page forward to current conditions, what is the Russell looking like at this time? In the chart above, I applied Fibonacci to the 2002 lows and the 2011 highs. As you can see the Fibonacci 161% Extension level seems to be heavy resistance this YEAR, as the Russell has had little success breaking from this level for the past 11 months.
The strong rally of late has taken the index to the underside of old support drawn off the higher lows, coming off the 2009 low. At this time the Russell is kissing the underside of resistance as it created a “Weekly Doji Star” pattern last week at (1) above. Doji Star patterns at resistance can become signs of a top!
CLICK ON CHART TO ENLARGE
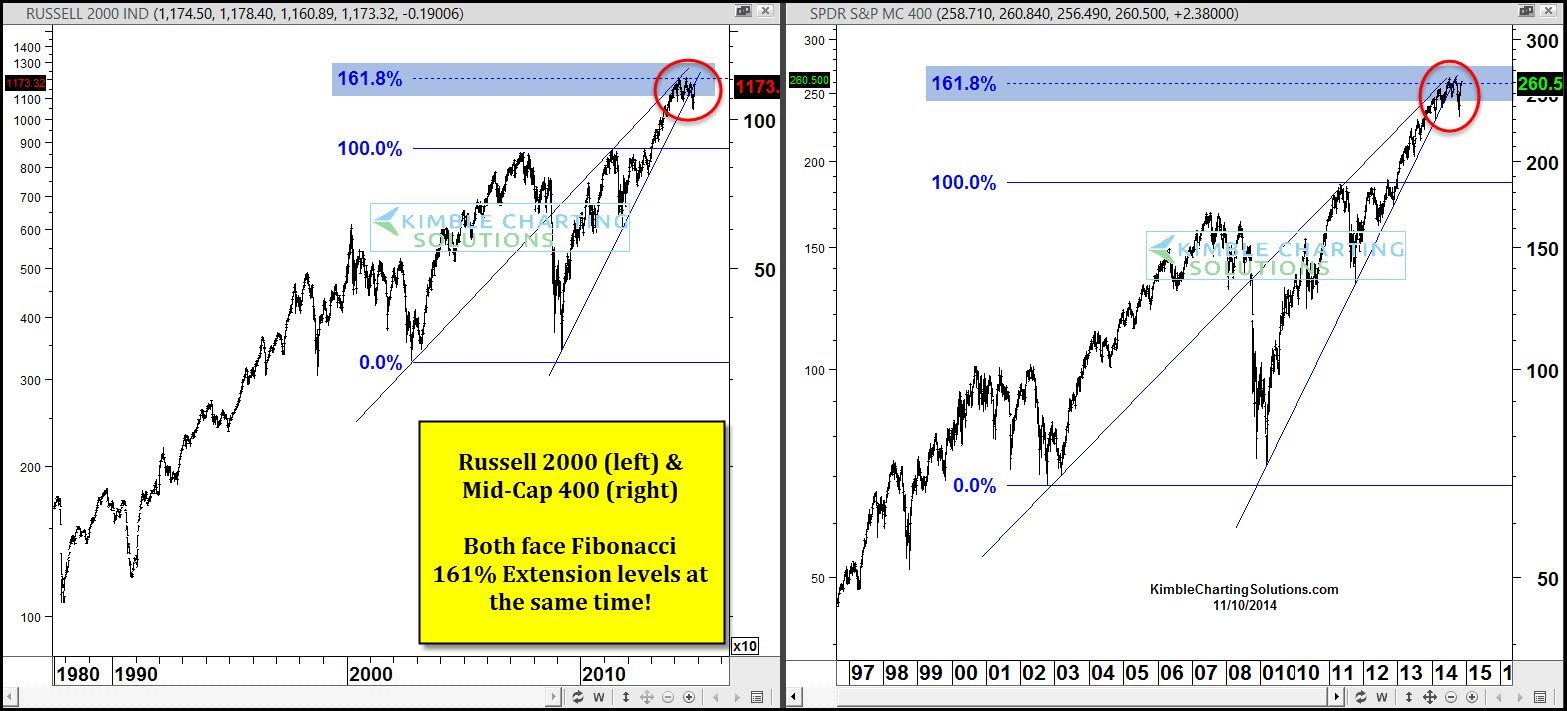
Does the phrase “So goes small caps, so goes the broad markets” apply here? Humbly I think it does! What these two do from here, could tell us a ton about where the S&P 500 is at year end!
–
See our new website ……Here
–
