
CLICK ON CHART TO ENLARGE
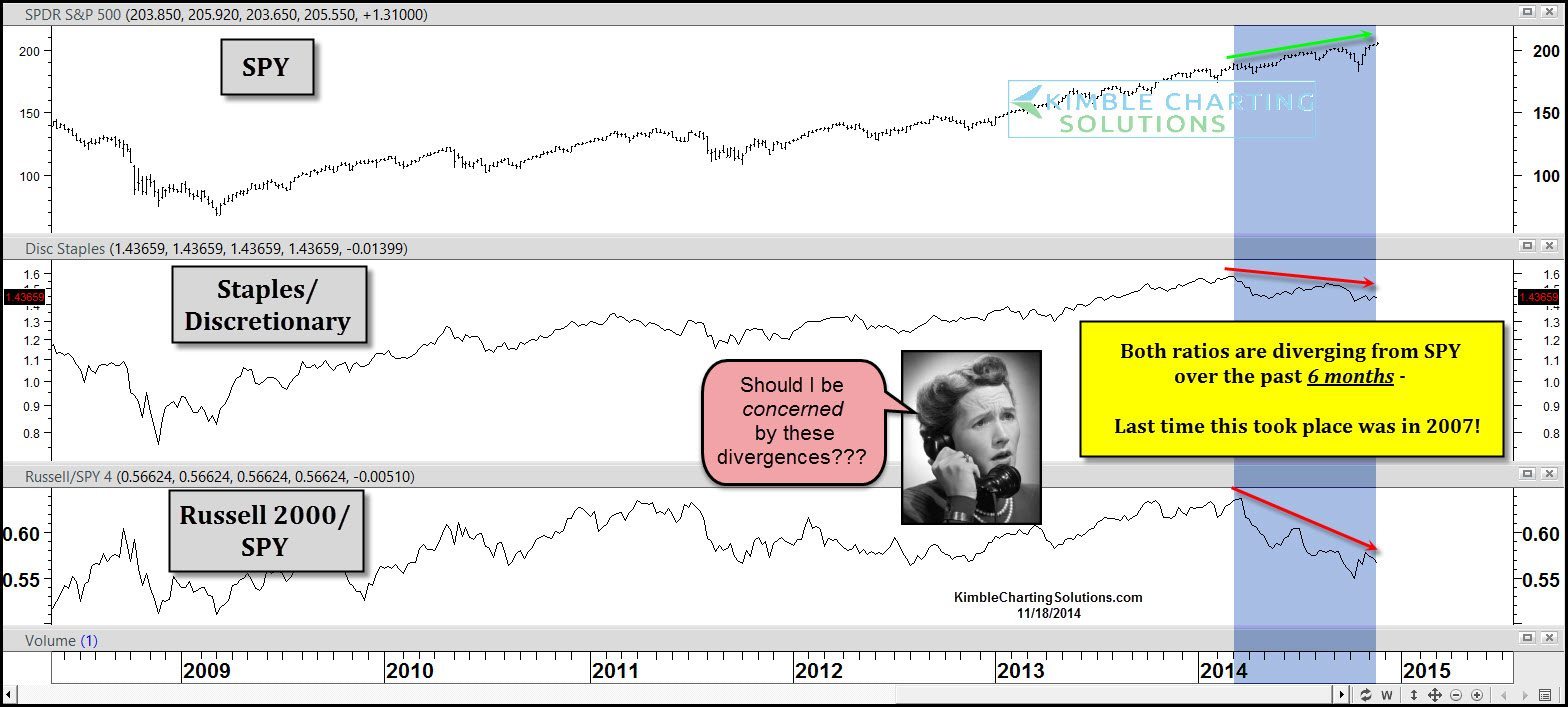
Looking back at 2006/2007, several key market indicators started diverging from the S&P 500, before the large decline in 2007/2008 took place. The above chart compares the Staples/Discretionary and Russell 2000/SPY ratios against the S&P 500 over the past 5-years.
The blue shaded areas reflects that both ratios started falling and diverging from the S&P 500, for the majority of the past 6 months. This is the first time that both of these have been heading down together and diverging for this long against the S&P 500, since the 2007 highs.
These ratios can been really important to your portfolio performance and the overall performance of the S&P 500. One day before the October low, the Power of the Pattern shared that Small Caps were poised for a rally. (See why here). After that posting, the markets have experienced the strongest short-term rally this year and one of the bigger surprise rallies in years.
It was these conditions that caused me to buy XIV and establish the largest number of bullish positions all year for Premium Members, starting on 10/15. In the following 30-days, XIV rose over 40% in value.
Is this a bearish sign for the S&P 500 going forward? This divergence should be respected and it could matter. At this time until our Shoe Box indicator, High Yields and Advance/Decline start heading down together, it “doesn’t matter, until it matters!” When these indicators do start turning weak, I believe these divergences will matter, a good deal.
–
See our website…..HERE
–

Chris: RE: your recent article on Divergences. Please read recently published “The Mystery of the Shemitah” by Rabbi Cahn. (Author of “The Harbinger” and its companion) It is not fiction – it is an eye opener and may answer some questions about the divergences. They,(divergences) by the way, are expected at this time. The down turn, at this time, is not cast in concrete- but – it is fairly certain to occur. The year of the Shemitah started September 24, 2014, and ends September 13, 2015. This is a biblical seven year blessing or judgment. There is a verifiable history affecting America’s financial situation. Check it out – I am sure you will not be sorry. Take care and God Bless
Your Friend in Jesus
Capt. Carrole Ward
Every high yield fund I look at is already heading down. Both HYG and JNK peaked in late-June, early-July. In addition, while the S&P 500 Advance-Decline line is still heading higher, the NYSE Advance-Decline line seems to have already peaked in late-August, early-September(along with the NYSE). And also of note the last couple weeks the S&P 1500 Advance-Decline line has shown weakness while the SPX had been still rising.