
CLICK ON CHART TO ENLARGE
With only 49 shopping days left until Christmas, I thought I needed to share my Christmas list.
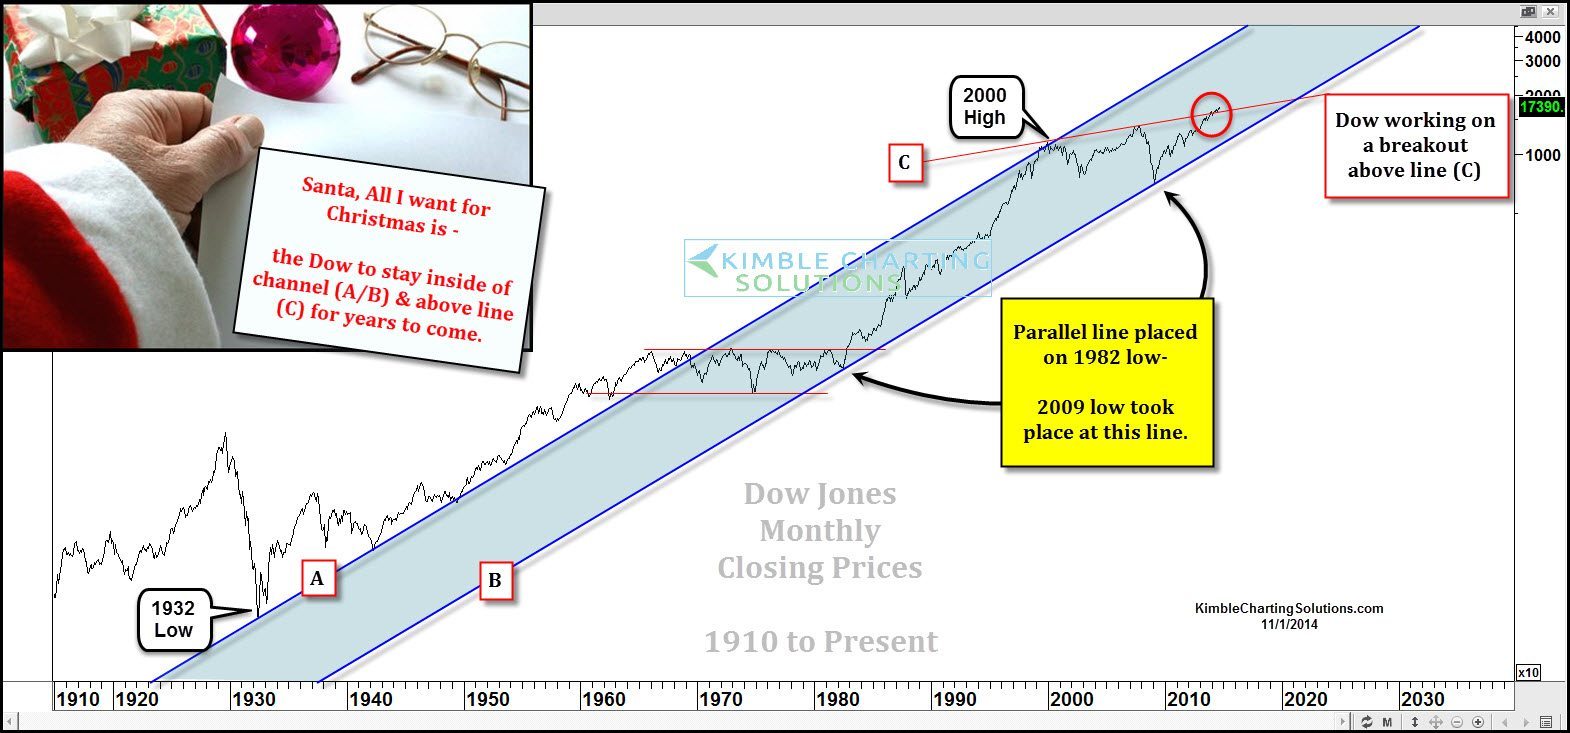
The chart above takes a 100-year look at the Dow and takes a look at a channel that has been in play since the 1930’s and a resistance line that could be being broken to the upside.
Line (A) is drawn off the lows in the 1930’s and it remained support until it was broken to the downside in the mid 1960’s. Once this support line was taken out, the Dow traded sideways for for almost 15-years. Notice that line (A) came back into play again in the year 2000, as resistance again!
I took line (A) and created a parallel line and placed it on the lows back in the early 1980’s. Notice that the Dow stopped right on this support line in the lows of the financial crisis in 2009.
At this time the Dow remains inside of its 70-year channel and is now making an attempt to break above resistance line (C), which has been in play for the past 14-years. From a “price perspective” an upside breakout is bullish.
No doubt valuations aren’t as low right now as they were in 1982 or 2009, as Warren Buffett’s valuation indicator is now hitting the second highest level in the past 60- years! See Doug Short’s look at the this ratio (here)
My Christmas wish….Santa, please keep the Dow inside its 70-year channel and above support line (C) for years to come. Should the Dow break below line (C), a new price trend could be at hand.
–
See our new website……Here
–
