
CLICK ON CHART TO ENLARGE
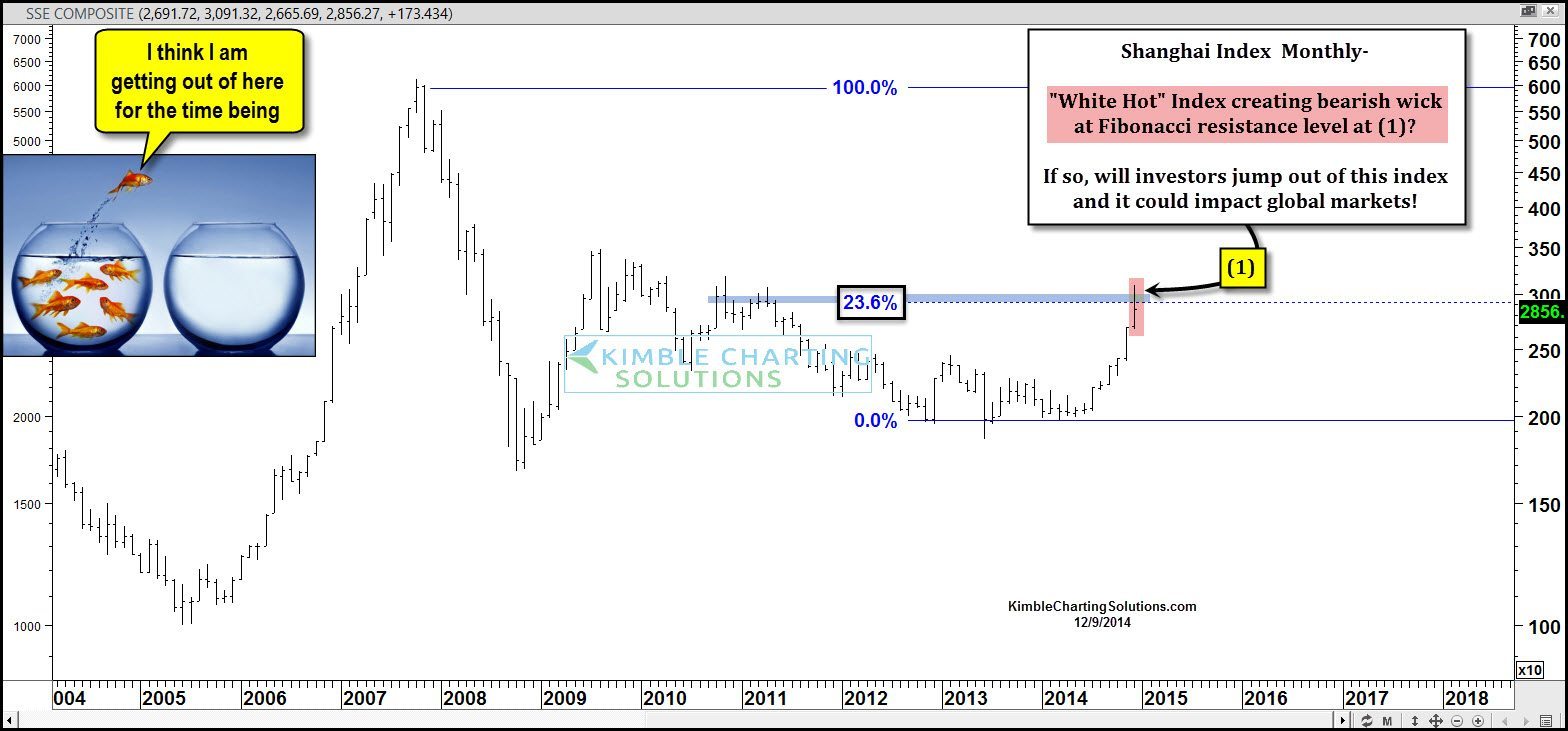
When it comes to year to date or the past 90 days performance, the Shanghai Index is at the top of the list for both time frames! No doubt this index has been white hot of late!
Even though the Shanghai has been screaming higher of late, the rally only has it back at its 23% Fibonacci resistance level, drawn off the monthly closing 2007 high and the 2012 low. The month is far from over with, yet a bearish reversal wick could be forming at this key Fib level.
Could this reversal wick be taking place at a key level for the S&P 500 as well?
CLICK ON CHART TO ENLARGE
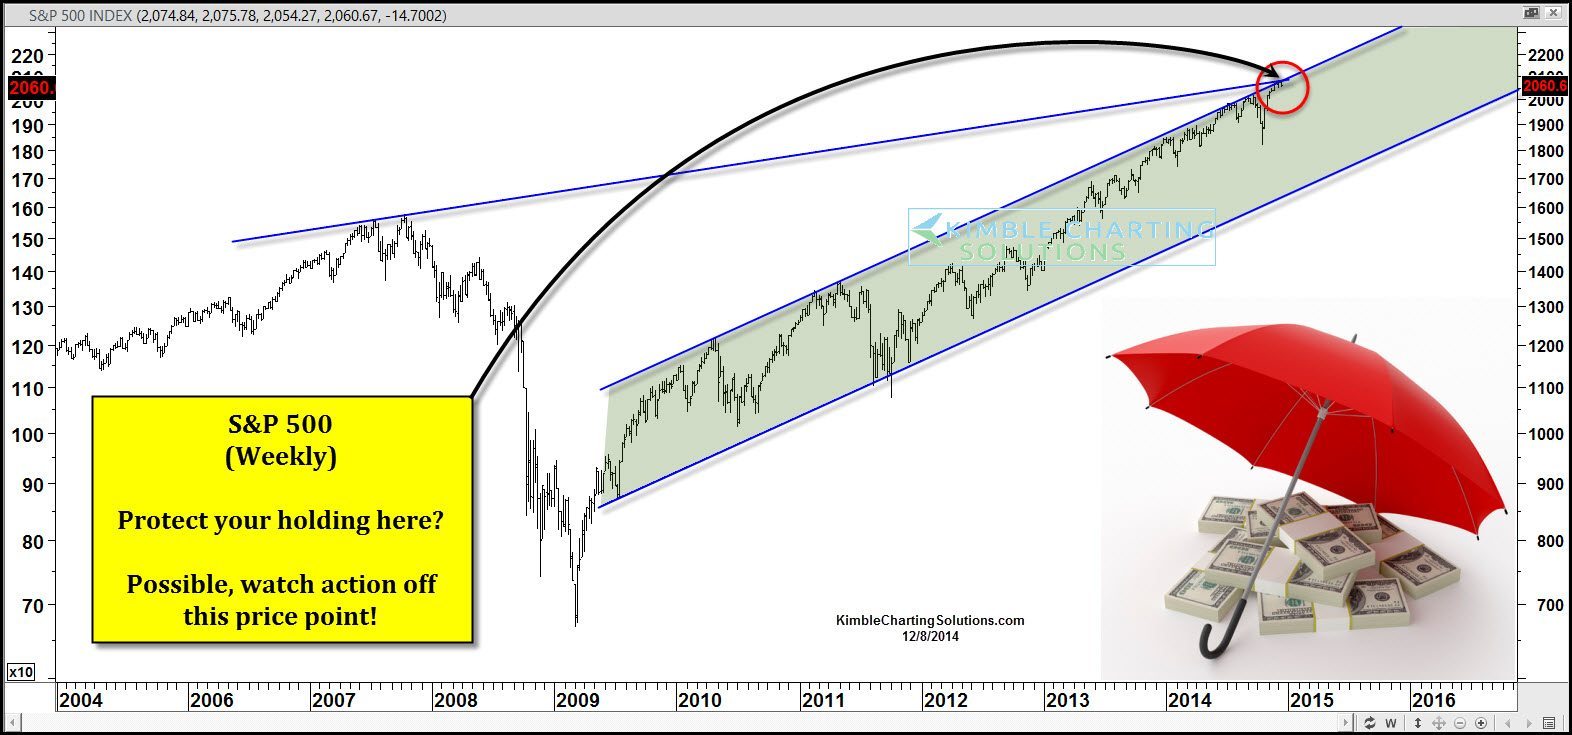
This pattern in the S&P 500 was shared yesterday, prior to the 5% decline in the Shanghai index overnight.
With the Shanghai index at Fib resistance and the S&P 500 (above) at the top of this multi-year rising channel, this is a price/pattern situation where some selling pressure could take place.
–
–
See more about our research at Kimble Charting Solutions (Here)
–

Hi Mike
Thx for the question. I love long term perspectives and linear doesn’t cut in on long-term charts. When all of us look at shorter term chart, both log and linear look pretty much the same. Another reason, I noticed 20 years ago that the people running billions/trillions were using them, so I attempt to see what they might see and then be ahead of them.
I appreciate the great question and your viewership of our blog. Chris
Why do you use a logarithmic chart?
You can also draw a nice line from the 2009 low, through the 2012 low, to about, well here, and – sort of – soon: about fall of next year. I mean, if it is legit to go all the way back to the 2007 highs, why then ignore the ’09 bottom? Just asking.