CLICK ON CHART TO ENLARGE
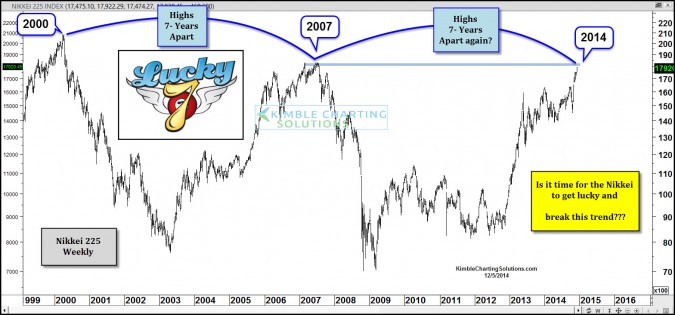
2007 was a unique year in Japan as their stock market peaked and Yen was about to embark on a strong rally…for a while. The above chart reflects that the Nikkei and Yen have had a wild ride the past 7 years.
The Nikkei peaked in 2007, fell hard for a couple of years and has spent the past 5-years attempting to get back to its 2007 highs.
When it comes to the Yen, it’s pretty much the same story, just in reverse. Has seven been a lucky number for the Nikkei?
CLICK ON CHART TO ENLARGE
The above chart reflects prior key highs in the Nikkei took place in 2000 & 2007, which happened to be 7-years apart. Now the Nikkei is nearing its 2007 highs, 7-years later. Is the Nikkei the only major market that seems to be influenced by this 7-year cycle?
CLICK ON CHART TO ENLARGE
The S&P 500 has had a couple of important highs in 2000 and 2007 as well.
Should both of these break from this cycle right now and the Nikkei above 2007 highs, it would have to be considered a very bullish event!
It won’t take long to see if “it’s different this time” or not!!!
–
–
See more of our research …..HERE
–


