
CLICK ON CHART TO ENLARGE
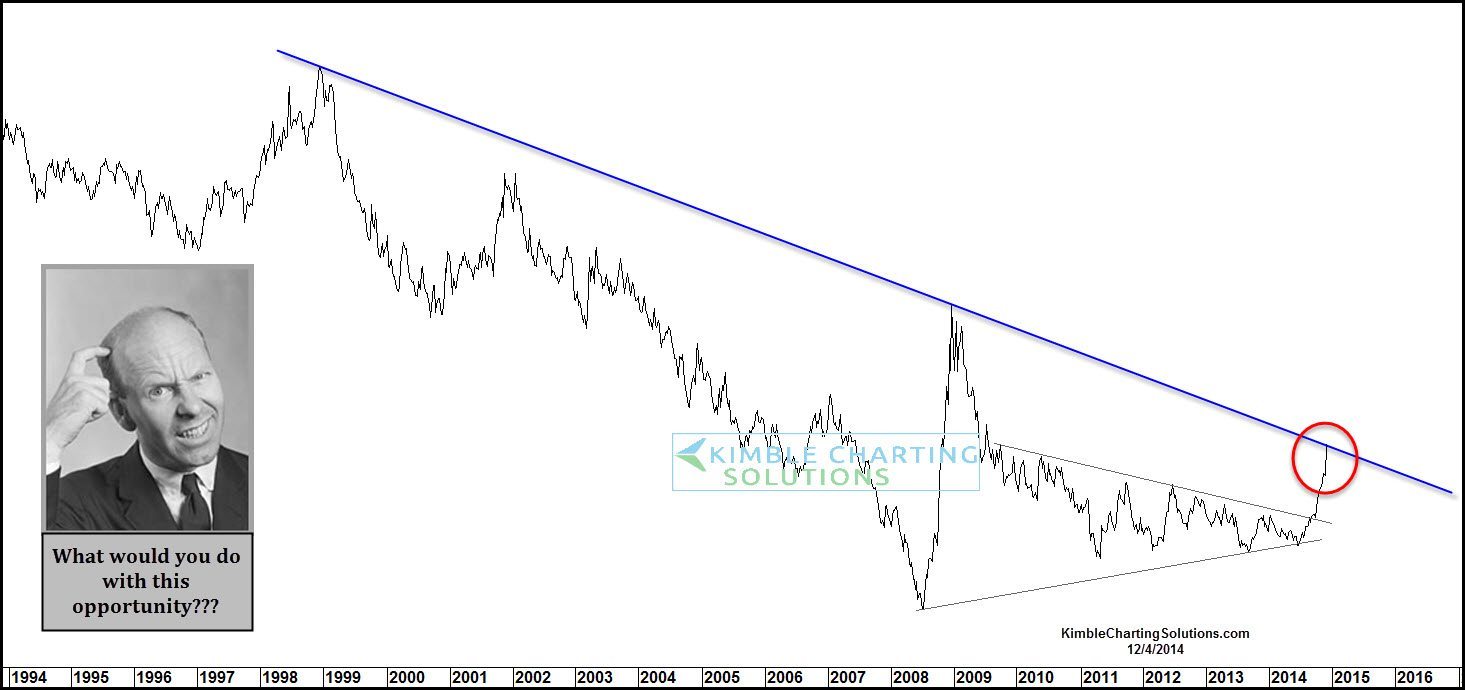
This long-term chart reflects a key test is at hand? What would you do here?
Humbly, I feel this is one of the most important assets on the planet and what happens here should impact all of us in many, many ways!!!
If you would like to share your thoughts on the pattern or would like the answer to this this quiz, send us an email to [email protected] and we will get you the answer to this quiz two days from now.
Again, I feel this is one of the most important situations we have seen in years, outcome is a BIG deal, IMHO.
–
–

Charles,
Here is the answer to the quiz of last week.
Thanks for you viewership, Chris
So whats the answer? You said two days and you would reveal what the chart is. That was on the 4th. Now its the 8th…..
inverted crude-as always use of this tool is a mind check on not letting psychology of news flow overwhelm you
Obviously the dollar, but I would wait for confirmation either way. No harm being a little late to the party – better than being toast! Thanks for sharing, Chris.
Chris…Looks like an inverted chart of WTI crude oil…Wait for the breakout either way then short or go long for a trade…John
Hey There Chris, love your work. Looks like $WTIC UPSIDE DOWN !
Chris…Sure like the way you are thinking! Cool straddle idea! Then we can join the IDC (I don’t Care) club and just pray for a big move. I shared this due to how rare of a pattern it is. All the best and Thanks for sharing. Chris
Dunno what it is, nor where it’s going. It is at a “wait and see how it jumps” position – could be worth a straddle, but I cannot see the option payouts.
I would be short, it may test the 2008 low again.
Looks like it’s breakout of the wedge has run it’s course (50% of wedges gap), as it hits the long time resistance line – likely to reverse and drop.
Short it or buy puts. It hit its long time resistance line and is going to reverse down. Also it looks like it hit a 50 % move out of the desending triandle. The 50% move is half of the triangle opening, and is also making lower highs and lower lows.
I would be interested in what that is the chart of.
Thank you
KING DOLLAR!!
wait for a b/o then buy the first p/b i assume its the bond chart