
CLICK ON CHART TO ENLARGE
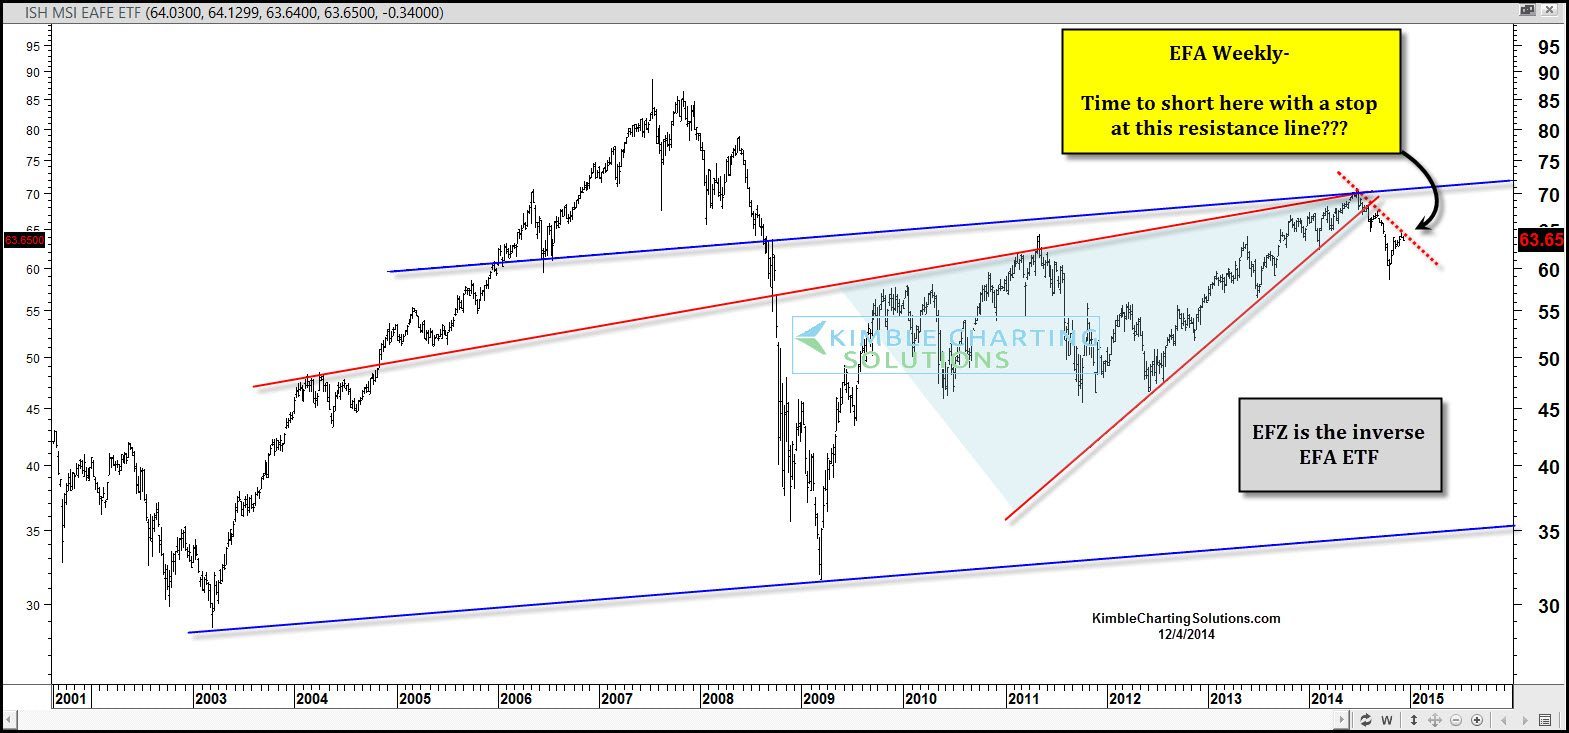
EFA ETF earlier this year created a bearish descending triangle at long-term resistance and then proceeded to break support. On October the 15th, the S&P 500 hit support and reversed higher, sending to all-time highs.
At the same time EFA DID NOT follow SPY very well, it actually reflected “relative weakness” against the broad markets with the small rally taking it up to falling resistance.
Premium & Sector/Commodity members last week shorted this ETF, by purchasing EFZ, as resistance was being hit.
If you are comfortable with these kind of trades/positions and would to get these ideas sent to your in box, I would be honored to have you as a member. You can get details at each of these pages or sign up at the bottom of each of these pages…For Premium Membership go HERE or Sector/Commodity reports go HERE
–
–
See our more of our research and website….HERE
–
