
CLICK ON CHART TO ENLARGE
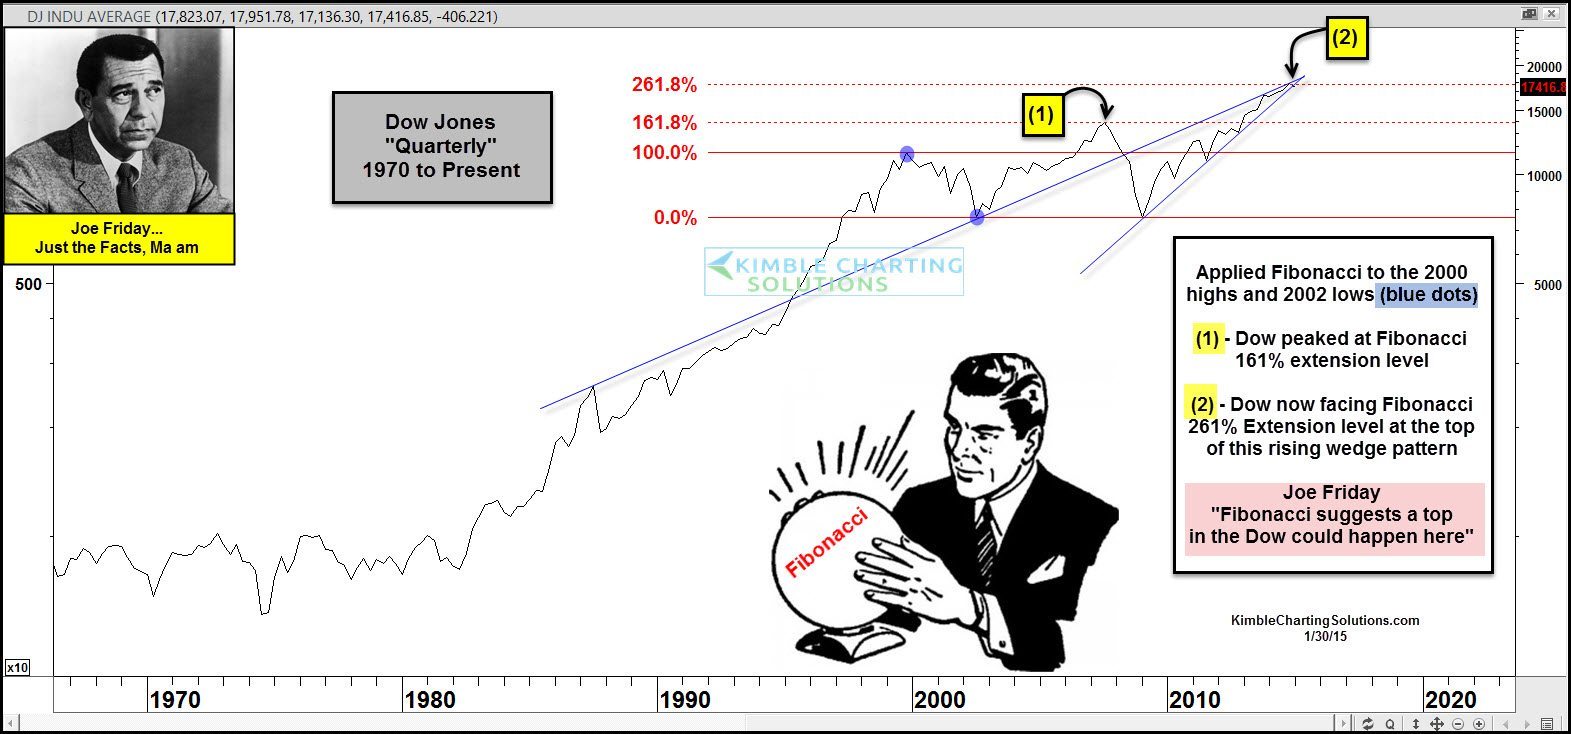
This chart is the Dow “Quarterly” dating back to 1965. I applied Fibonacci to the Dow’s 2000 high and 2002 quarterly lows and then applied Fibonacci extension levels.
The Dow stopped on a dime in 2007, as it hit the 161% Fibonacci extension level at (1).
Now the Dow is hitting the Fibonacci 261% Fibonacci extension level at (2). While at this level, a long-term resistance line comes into play that ties in the 1987 highs and the 2002 lows.
Joe Friday, just the facts….This is not your typical resistance level and the Dow could put in a peak at this combo!
A reminder, this is a quarterly chart, will take time to prove or disprove if this Fibonacci extension level will impact the Dow.
–
–
See more of our research…..HERE
–
–
