
CLICK ON CHART TO ENLARGE
When it comes to currency strength, King Dollar had a pretty good 2014! Speaking of strength, the US$ ETF (UUP)/Euro ETF (FXE) performance spread between the two, has been 23% over the past 6 months. (See spread here)
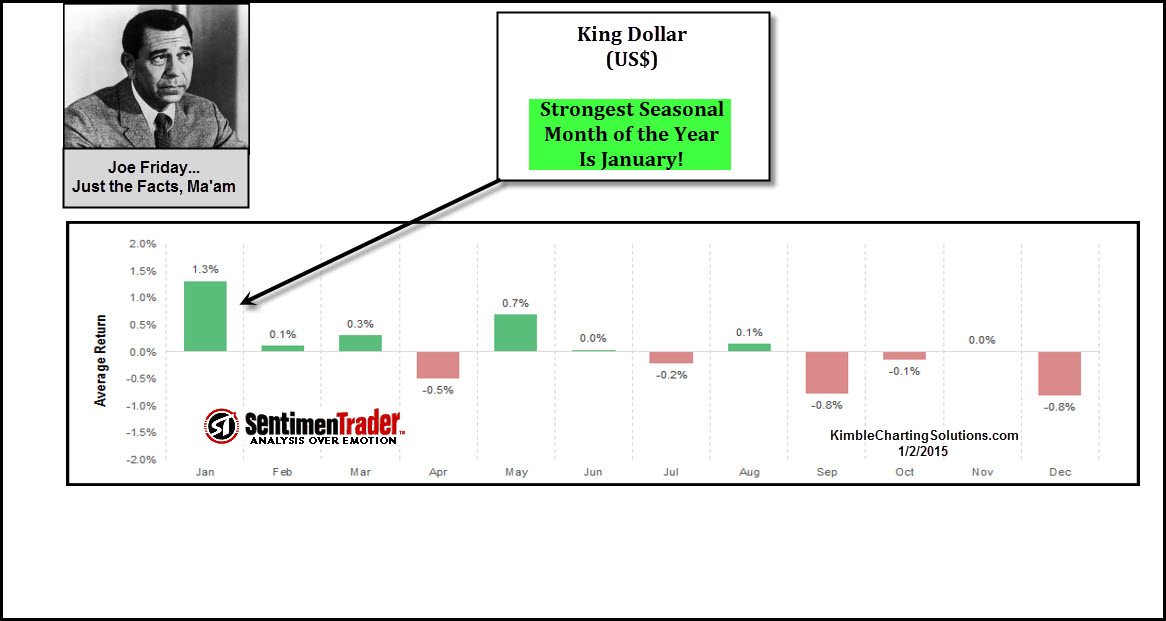
The above chart, from Sentiment Trader, highlights that the US$ is now entering its strongest seasonal month of the year and its strongest 90-day window of the year too.
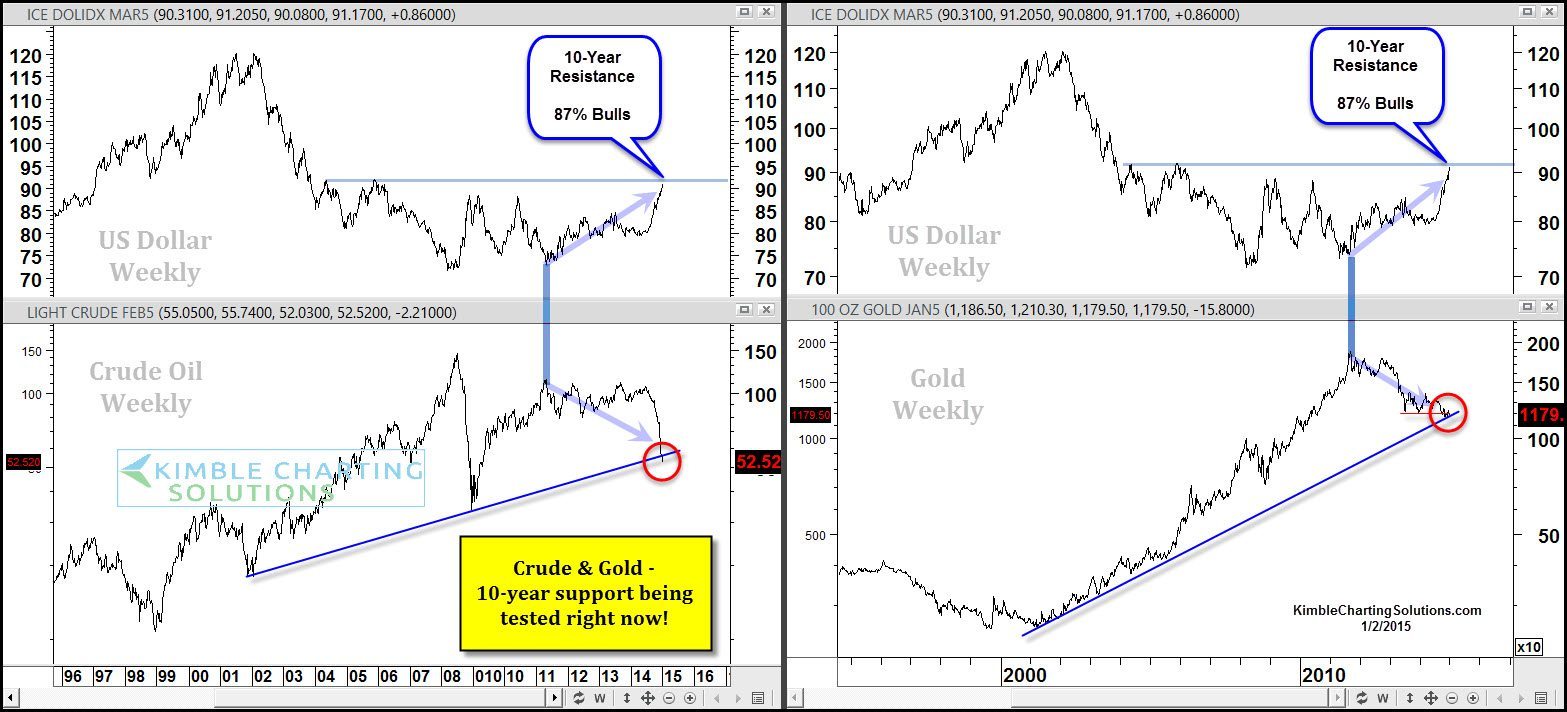
As the US$ is entering its strongest seasonal month of the year, the chart below reflects that it is nearing a 10-year resistance line, as 87% of investors are bullish the US$ right now.
CLICK ON CHART TO ENLARGE
The above chart reflects that the US$ has rallied for the past three years and Crude & Gold have done the opposite.
All three are testing 10-year support/resistance lines, at the same time. This is the time of year that many predict or are ask to predict what they think will happen in the upcoming year. I will let Joe do the talking today.
Joe Friday, just the facts Ma’am…The US$ is now entering its strongest seasonal month of the year. What the US$ does at the 10-year resistance line should tell investors a ton in regards to if support will hold or fail in both Crude & Gold!
–
–

Impressive Charts
Dear Mr.Kimble
I wish you a healthy and wealthy 2015!
Congratulations for your wonderful insights!
Chaim Kimelblat aka [email protected]
You would think a very good chance for a bounce at the very least…Looks like crude has already violated the trend line…Given the somber prospects for a happy-ending in Euroland near term…The $USD or even Euro-gold would be the best bet…JS
On behalf of the late Joe Friday, thank you for correcting his spelling to “ma’am.”
Enjoying your charts & commentary.
Regards,
AW