

CLICK ON CHART TO ENLARGE
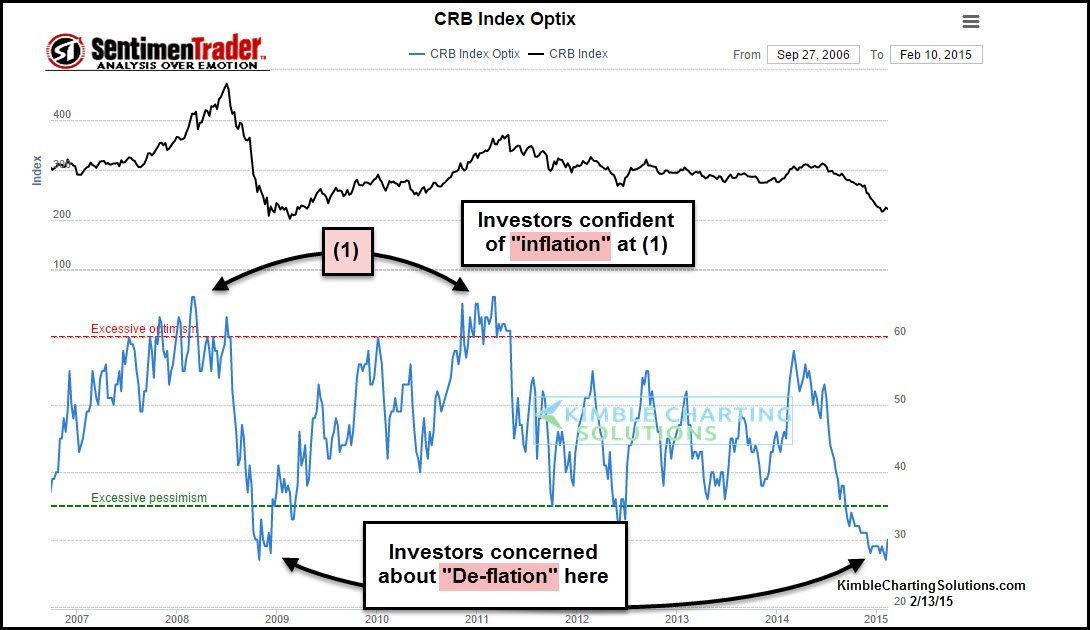
The large decline in Crude Oil and some other leading commodities of late has caused many to wonder if the world is entering into a period of “deflation.” The above chart takes a look at the Thompson Reuters Commodity Index, over the past 50 years. The index hit a high back in 2011 as investors were very confident that commodity inflation was going to take place at (1) in the chart below (70% bulls). Boy was this crowded trade on the wrong side of the fence!
Now the decline in the commodity index has investors discussing deflation and only 30% of investors are bullish commodities. Sentiment chart below from Sentiment Trader
CLICK ON CHART TO ENLARGE
The top chart reflects that the TR index hit the underside of a 10-year support line, now acting as resistance at (1) last year and then the bottom fell out. This pattern was sending a bearish message to the commodities complex well BEFORE the Crude Oil slide. That is all behind us now, what do current conditions look like?
The TR index decline now finds itself at the 50% Fibonacci retracement level, of the 11-year bull market in commodities, as well as two other potential support lines at (2) in the top chart. Few investors believe that commodities will move higher from current levels, just 30% bulls right now. Government Bonds have done well during the commodity decline, as they like the idea of deflation.
Joe Friday just the facts….The world gets lucky on this Friday the 13th if the TR commodity index finds support at (2), because the lower line of a multi-decade rising support channel comes into play 30% BELOW current levels. The world might want/need commodities to find support here and now!
–
For details on Power of the Pattern daily or weekly research being sent to you

–
