
 CLICK ON CHART TO ENLARGE
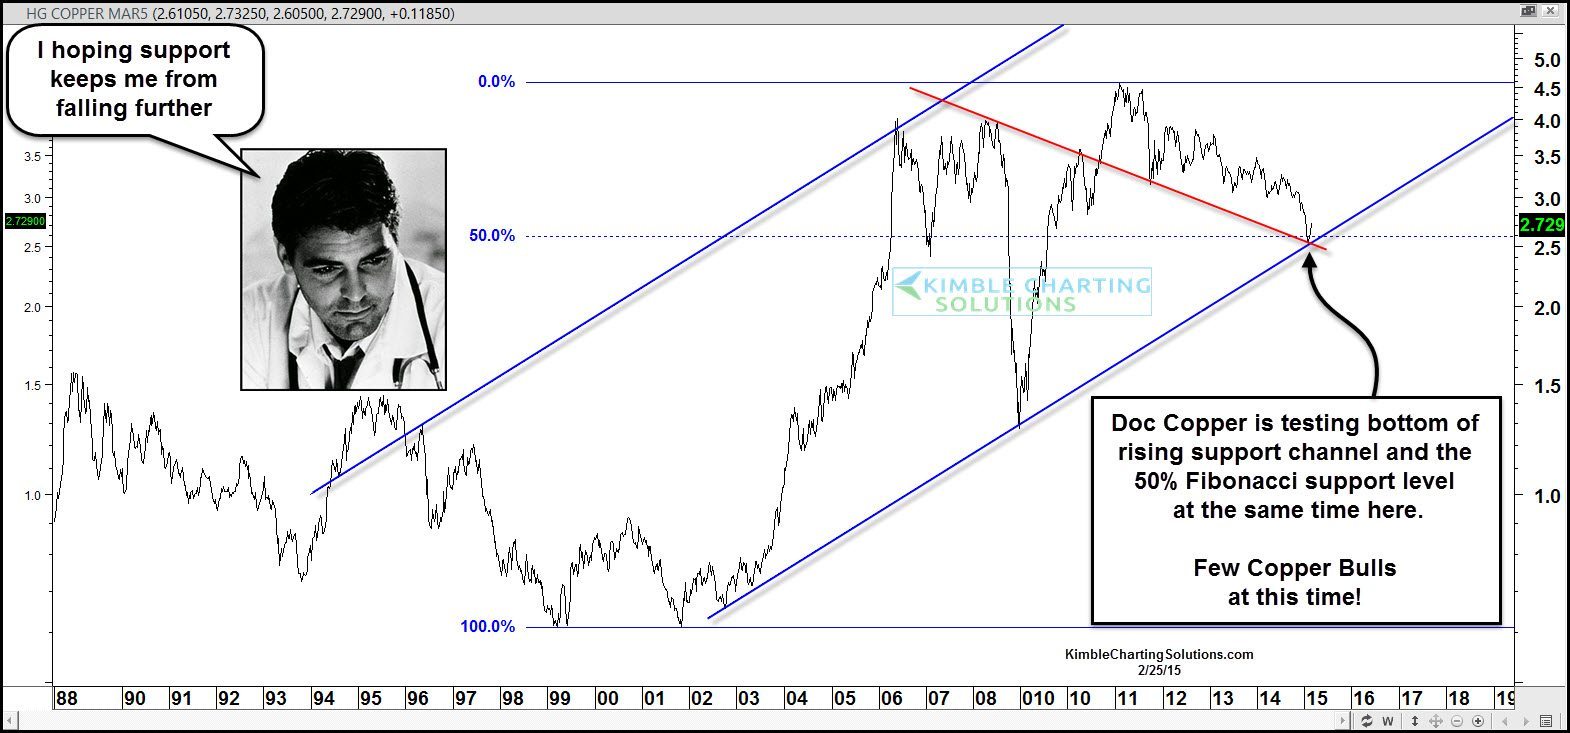
Doc Copper has been under the weather the past few years. After hitting the $4.50 level back in 2011, it has proceeded to lose around 40% of its value over the past four years.
The Power of the Pattern finds three situations very interesting right now-
First… the large multi-year decline now has Doc Copper testing a 12-year support channel.
Secondly…. Copper now finds itself at the 50% Fibonacci support level, based up the 1999 low/2011 highs
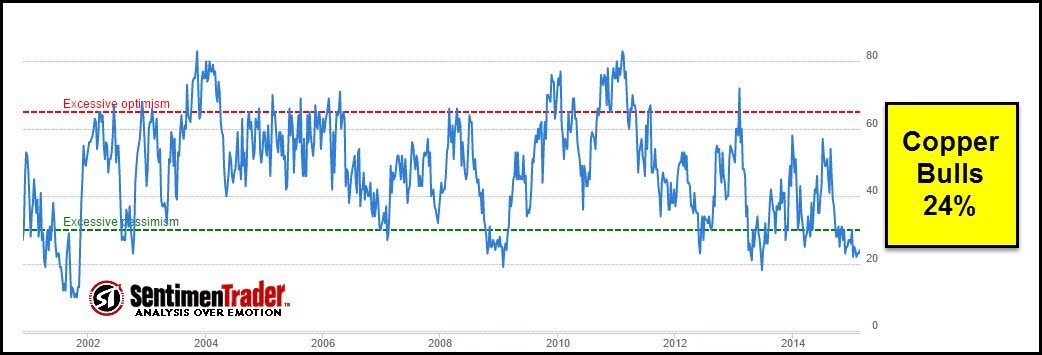
Third…Copper bulls are not easy to find, only 24% at this time, see below (Sentiment Trader)
 CLICK ON CHART TO ENLARGE
The rising channel (top chart) is formed off the lows in 2002 and 2009. As you can see above, sentiment is very near where it was at those key lows.
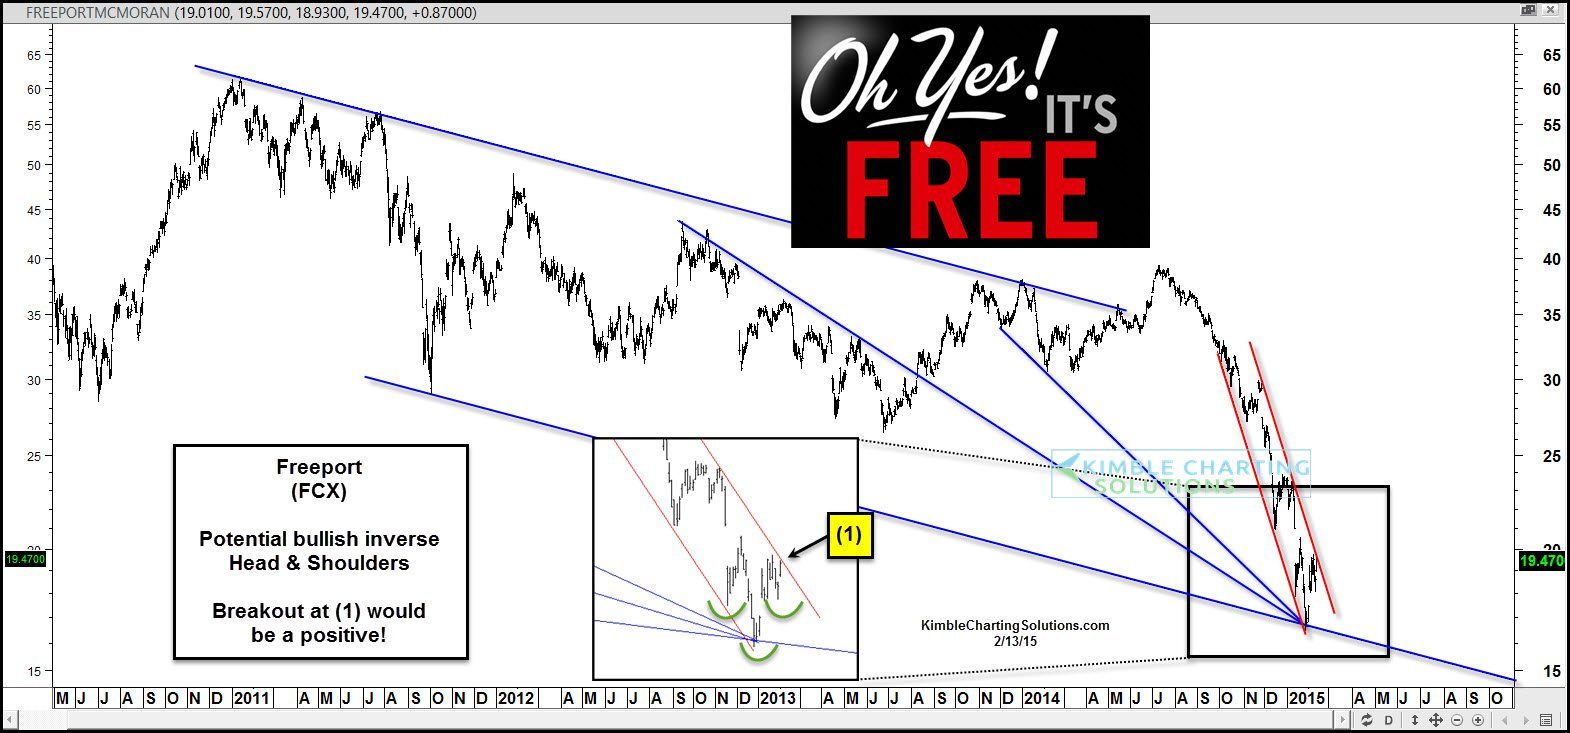
I shared the chart below on Friday the 13th, (Free Trade Day) which reflected that Freeport McMoran (FCX) looked very appealing from a Power of the Pattern perspective (see post here) FCX was hitting a cluster of support and might have been making a bullish inverse head & shoulders pattern at (1) below.
 CLICK ON CHART TO ENLARGE
Two weeks ago, at the time of the post, FCX was trading at $19.47. As of last night’s close, FCX has broken above falling channel resistance and has rallied a little over 10%. Looking OK so far, from a Power of the Pattern perspective.
Full Disclosure- Premium Members are Long FCX, with a purchase price of $19.01.
Should Doc Copper hold at support start pushing higher, could it be sending a message that economic conditions are improving? It is to soon to make that call at this time. Humbly, I do feel Copper would send a concerning global message should it breakdown below these support points!
To see details on Premium Membership…

–
