
 CLICK ON CHART TO ENLARGE
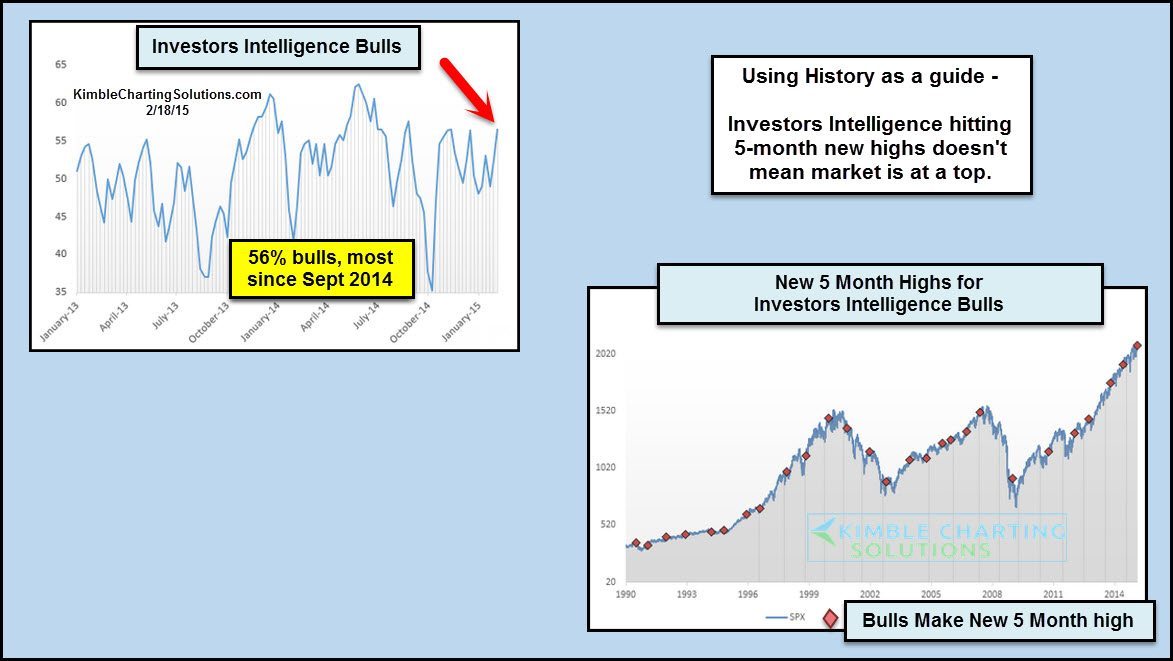
Investors Intelligence reports that the current bullish level now stands at 56% (upper left chart). This is the highest reading since September of 2014. The lower right chart looks at the S&P 500 over the past 25 years and plots when new 5-month highs in II Bulls were taking place.
 CLICK ON CHART TO ENLARGE
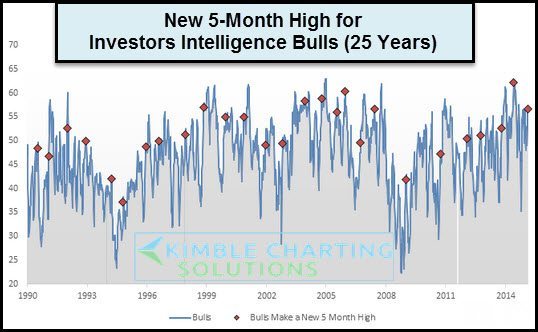
This charts looks at the S&P 500 over the past 25-years and plots all times when bulls were making new 5-month highs.
If one uses history as guide in the top chart, you can see that 5-months highs took at a variety of lows and highs. Would seem that hitting a 5-month high does not mean the market is at a top at this time.
–
–
