
CLICK ON CHART TO ENLARGE
Happy Lunar New Year to all viewers, especially those from China. Wishing all of you a very prosperous year ahead.
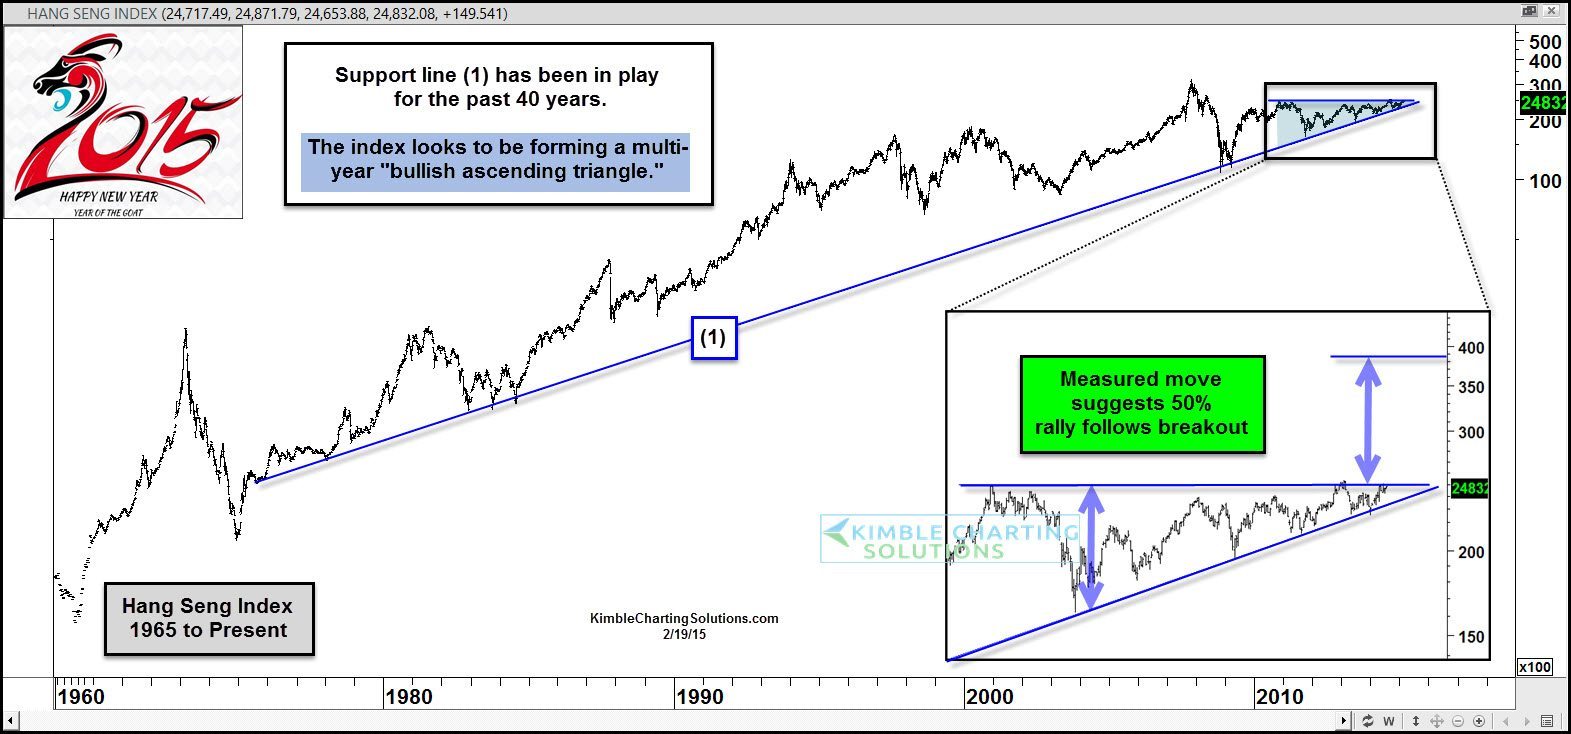
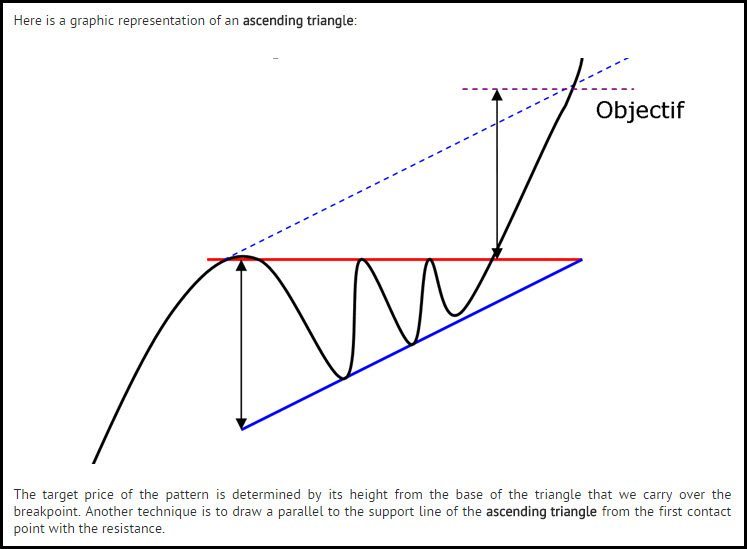
The chart above takes a look at the Hang Seng Index since 1965. The index remains above 40-year support line (1). Over the past few years billions of free thinking people around the world look to have created a multi-year bullish ascending triangle. According to Forex Tribe, 62% of the time an upside breakout takes place. See Ascending Triangle pattern below.
CLICK ON CHART TO ENLARGE
What has my interest is this… 75% of the time an upside breakout takes place, the higher target is reached. What is the higher target? To create a measured move you take the height of the ascending triangle and then lay it on the top of the pattern to measure upside potential. The inset chart takes a closer look at the multi-year ascending triangle and applies a measured move to the pattern.
The measured move suggests that the Hang Seng index will rally around 50% should an upside breakout takes place. China represents one sixth of the worlds population. I wonder what China and the world would look like if this important index finds itself 50% higher years from now.
For upside potential to even start to come into play, overhead resistance of the pattern has to be taken out!
The Power of the Pattern suggests to keep a close eye on this pattern and watch to see if a breakout takes place. If it does, it might be worth owning plays in this region and FXI could do well.
–
Details on Power of the Pattern research can be found below 
–
