

CLICK ON CHART TO ENLARGE
The first table this morning looks at the American Association of Individual Investors (AAII), Bulls/Bears Per Year, since 1987. So far this year, the largest percentage of investors feeling bullish is hitting the highest levels since 2004. Also at this time, the lowest percentage of investors since 1999, are feeling bearish.
CLICK ON CHART TO ENLARGE
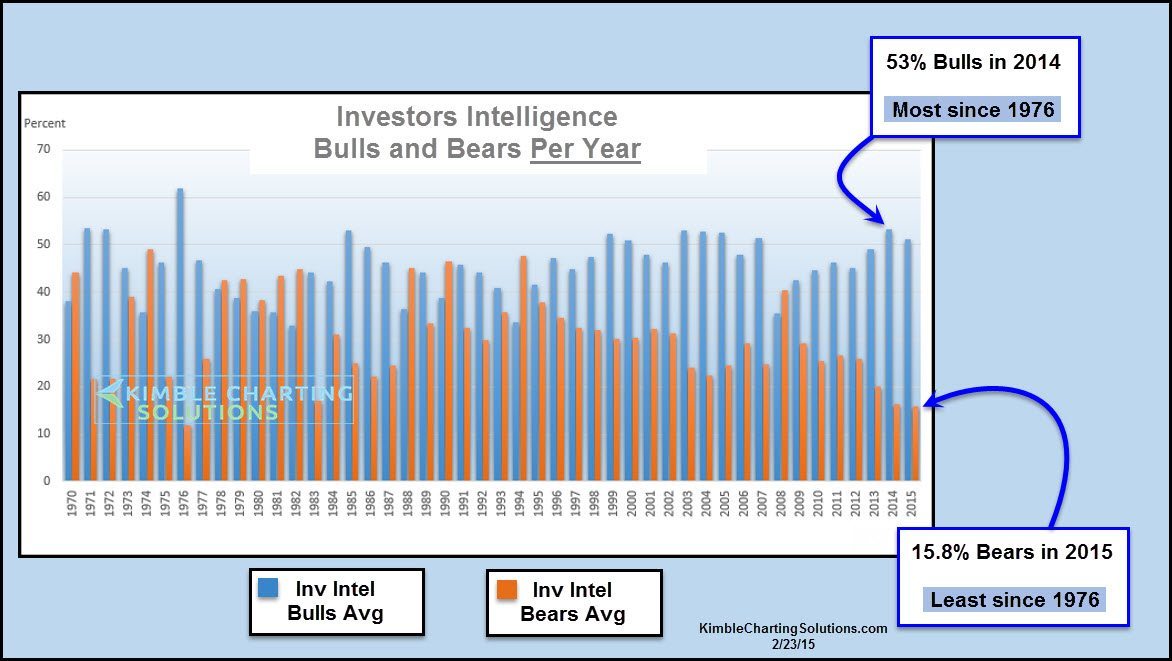
This table takes a look at Investors Intelligence (Advisors Sentiment). At this time the II survey is hitting bullish and bearish readings not seen since 1976.
CLICK ON CHART TO ENLARGE
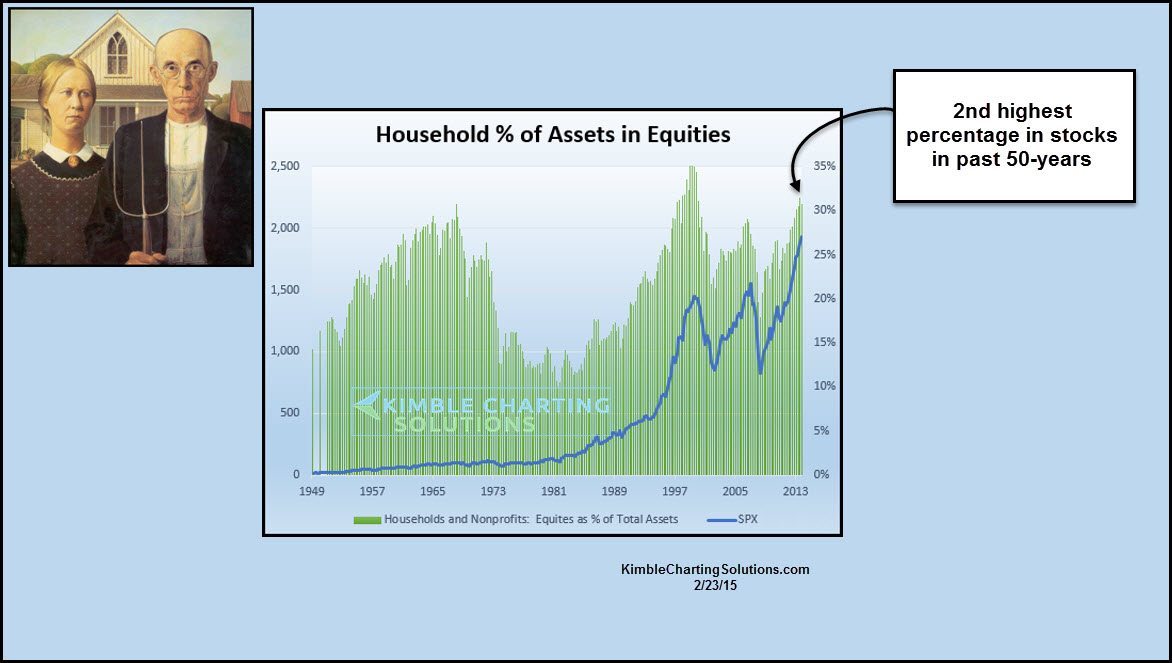
This table looks at the percentage of “Household and Non Profit Assets in Equities.” Currently around one-third of households assets are invested in the equities markets, reaching fairly high levels, only surpassed by levels hit in 2000.
Last night J.C. Parets mentioned that “Headlines are opinions and price is a fact!” Surveys also fall into the “opinions” category. I do respect opinions of investors and newsletter writers, they can be very helpful to us at extremes. My favorite way of making investment decisions is based upon the Power of the Pattern, which is based upon price.
At this time in the equities markets, long-term trends are above key moving averages and trend lines. Should price start reflecting weakness, along with our Shoe Box Indicator, High Yields, Advance/Decline line, that is when I would become concerned, much more so than where these sentiment tables stand at this time.
To receive Power of the Pattern research on a Daily or Weekly basis

–
