
CLICK ON CHART TO ENLARGE
According to my parents and brother, when I was a kid I used to ask “What If” way too often. So this morning I am reverting back to my childhood (assuming I have actually grown up) and am asking “What If” again.
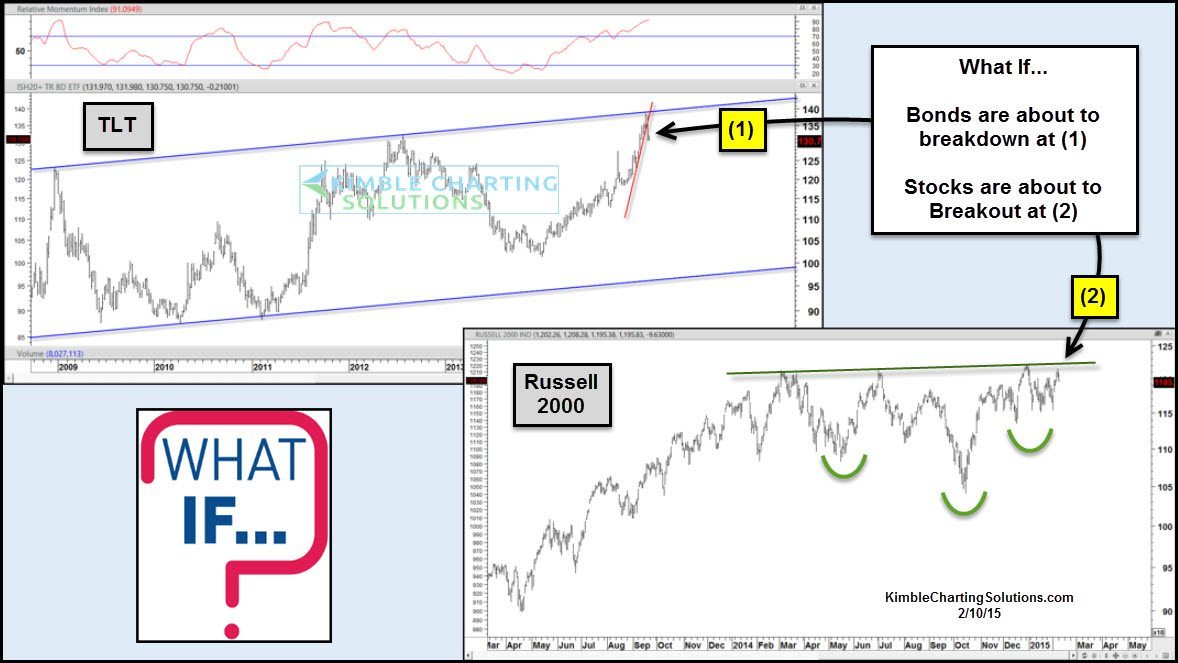
The upper left chart is TLT, which could be at the top of its rising channel with momentum overbought..
The lower right chart is the Russell 2000 as its just below a 14-month resistance line.
Now lets play “What If!” Could TLT be breaking short-term support, at long-term resistance at (1)? Could the Russell be making 14-month inverse bullish head and shoulder pattern at (2)?
The odds may be low that this “What If” theme is correct. If it is on track, the impact to portfolio construction could be large. Stay tuned because if these pattern reads are correct, opportunities will be in play.
Would be honored to have you as a member, for details- 
–
