CLICK ON CHART TO ENLARGE
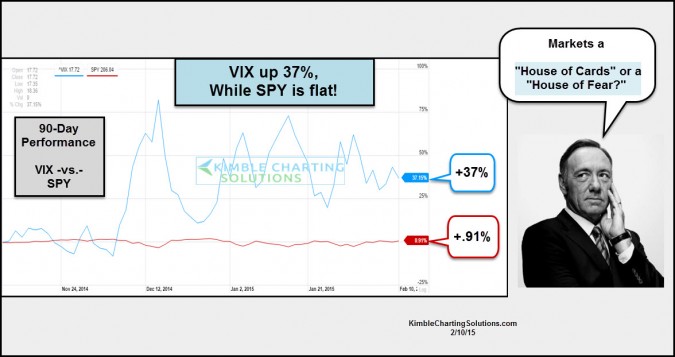
Do some investors think the market is a “House of Cards?” Humbly I don’t know. It sure seems like something has them concerned, as fear levels remain lofty with the market making little progress up or down!
Over the past 90-days the S&P 500 is pretty much flat (up less than 1%). During that time the VIX (Fear Index) remains elevated, as its been up the majority of the time the market has been going sideways.
CLICK ON CHART TO ENLARGE
The VIX looks to be creating a pennant pattern over the past few months. How this pattern resolves itself could point to which direction SPY heads out of this sideways chop.
CLICK ON CHART TO ENLARGE
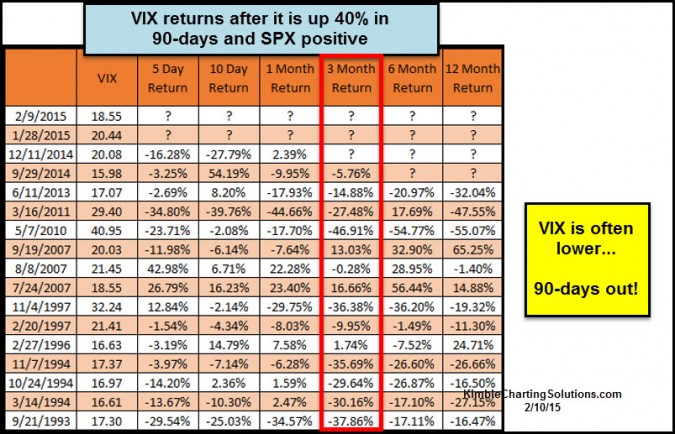
This table highlights what happens to the VIX after its up 40% in 90-days when SPY is positive. Majority of the time 90-days out the VIX is lower.
Falling fear can be positive for stocks and for XIV. If the VIX falls during the next 90-days, XIV could do fairly weel. Let’s see what happens from here!
–
See how you can receive our research on a daily or weekly basis…HERE
–


