
 CLICK CHART TO ENLARGE
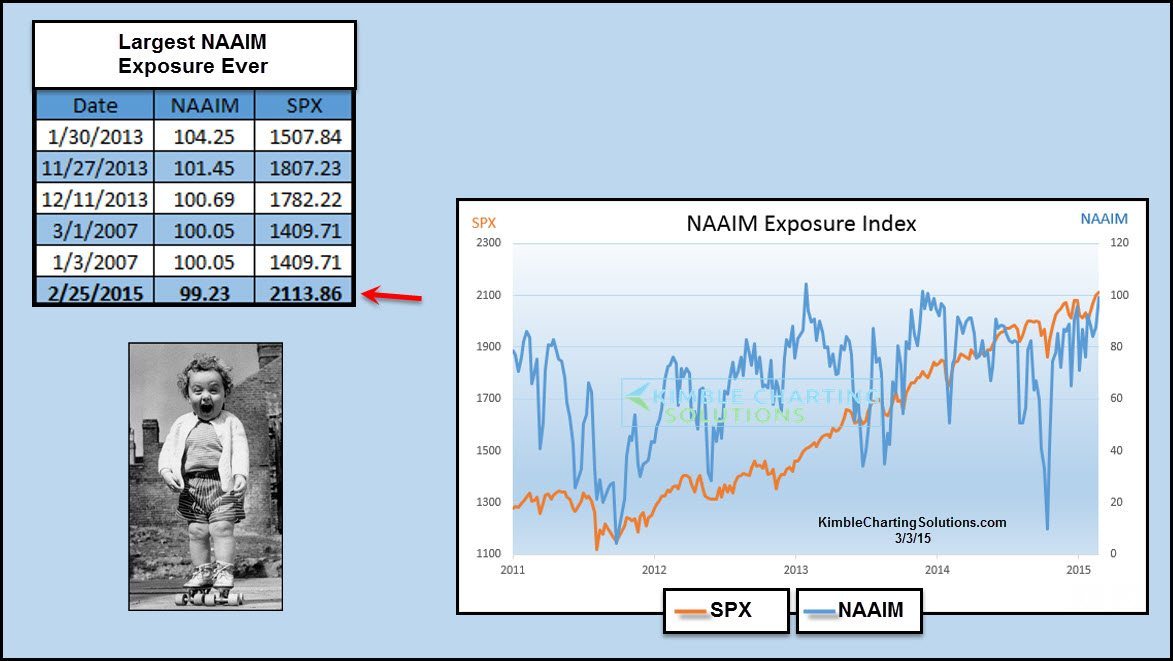
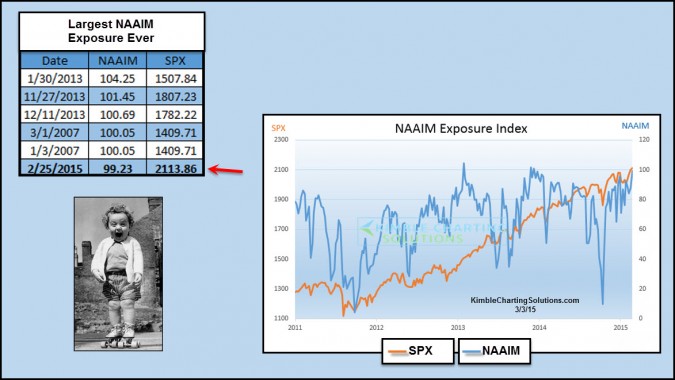
With many of the major stock indices hitting all-time highs, would it be a surprise to see money managers excited about the markets? If they would happen to be excited, could that be a bearish signal for the markets?
The upper left table reflects that the National Association of Active Investment Managers just hit the 6th most exposed to equities level, since data started back to 2006. The lower right chart plots the NAAIM on top of the SPX since 2011.
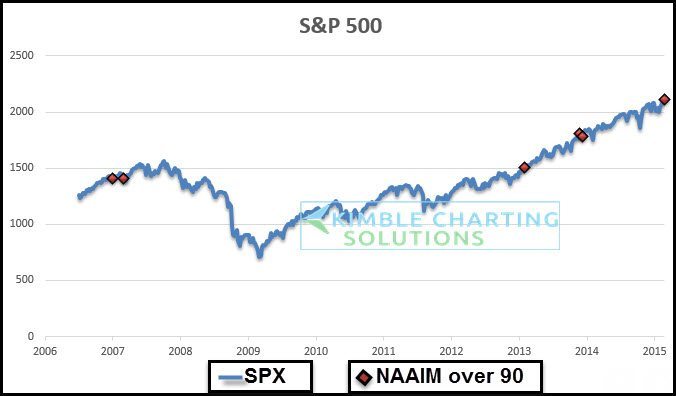
The table below plots the times that the NAAIM came in with a reading over 90, since 2007, overlay-ed on top of the S&P 500.
 CLICK TO ENLARGE
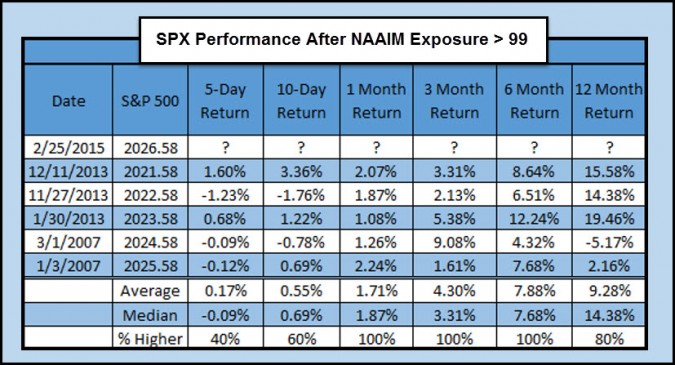
The table look looks at S&P 500 performance after the NAAIM exposure was greater than 99
 CLICK ON CHART TO ENLARGE
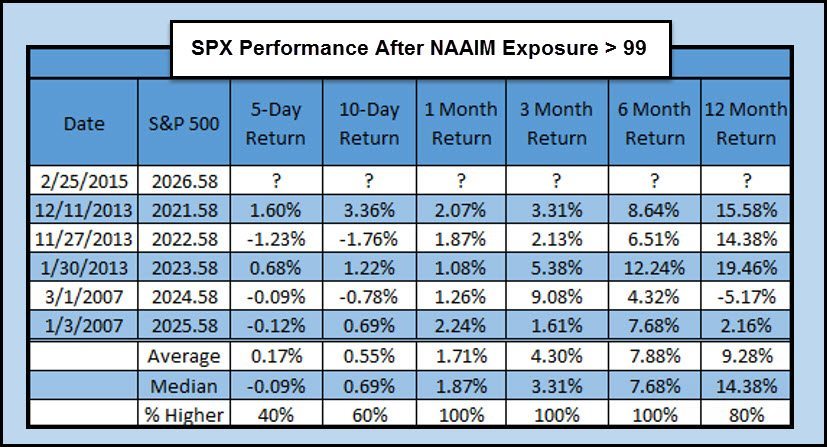
Summary – Active managers are near the most bullish they have ever been and in my humble opinion, this is something to respect. Historically, this survey alone isn’t a major contrarian warning. I remain focused on messages from our Shoe Box indicator, high yield funds, Advance/Decline ratio and the Discretionary/Staples ratio.
–
