
 CLICK ON CHART TO ENLARGE
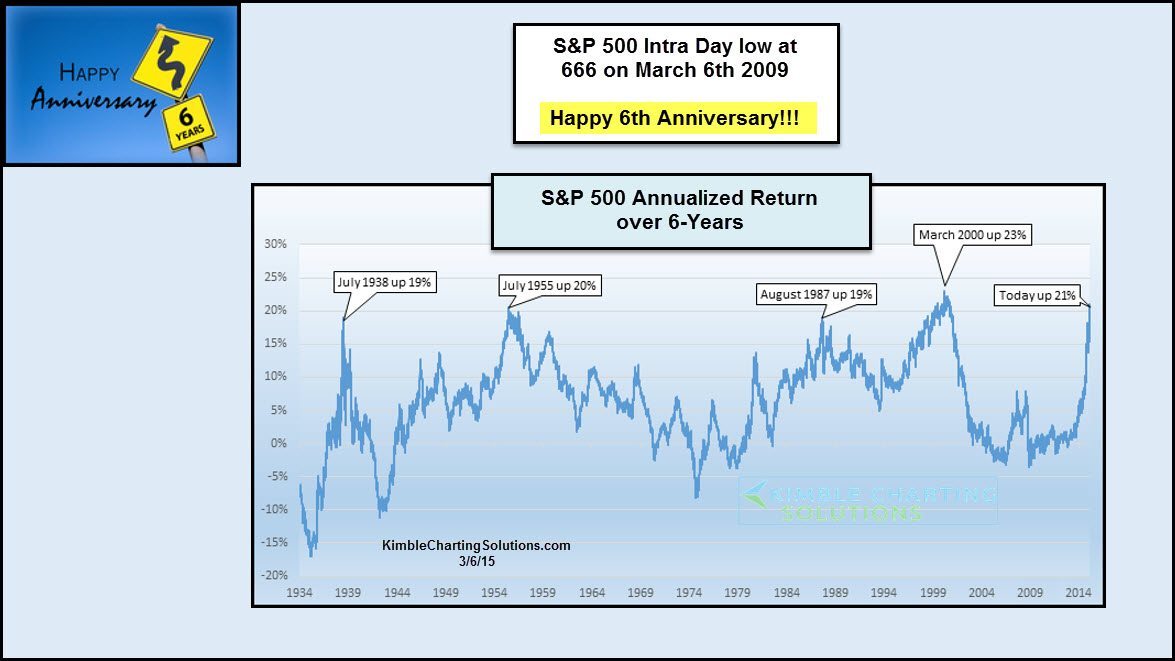
Happy 666 Anniversary everyone!
6-years ago today (3/6/2009) the S&P 500 hit an intra-day low of 666 and then proceed to take off to the upside. As you can see to the right side of the chart, the S&P 500 has averaged 21% annualized returns over the past 6-years. The chart looks at other 6-year windows of time and looks at annualized returns since the early 1930’s.
As you can see when you compared other six year returns that averaged 19% or more, the recent run up is rather steep!
Would it be odd that 6-years after the low, the S&P hits a high?
I also wonder what the 6-year annualized return will be 6 years from now??? Any guesses anyone???
Thanks for your viewership everyone, its been a really blessing to have you looking at the Power of the Pattern over the years!
–

Excellent chart! The 6yr annualized return is an Eiffel Tower much like the 1938 peak in your chart! Nasdaq 5000 sure made the news this week as everyone seems to be buying Apple right now. My 40-something buy-and-hold co-workers are all in this market right now and NONE of them view cash as an option. Very dangerous. The train feels fully loaded with many signs of major breakout turning points (e.g. Euro is breaking down, USD is breaking up, emerging markets breaking down, Utilities and REITs diving from peaks). Let’s see where it goes!