 CLICK ON CHART TO ENLARGE
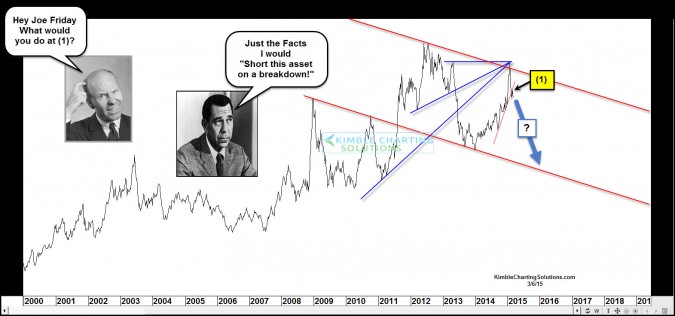
In an attempt to “reduce my own bias” I have a way to look at chart patterns, without knowing what the underlying asset is. Doing this exercise has helped me for over 20-years, to look at the patterns billions of free thinking people have created with less bias. I see the pattern for what it is and nothing more.
Joe Fridays says he would short this asset at (1) on a break of support, if it does. What would you do?
If you’d like to share you opinion on what action you would take/how you would trade it or would like to know what is is ASAP, send us an email to [email protected]. I will share what asset this is next week on the blog.
Let me share this…should this asset move in the direction Joe is thinking, I suspect the world will find it very important and impact-full on a global scale!
To receive research like this on a daily or weekly basis….Click Below for details
–


Double top plus false breakout from down-sloping channel. Two lines of resistance. Elliott wave Rorschach test: impulsive down (from the peak), corrective up. So far so good. Last thing I want to know is what’s my downside if I use these to set a stop? Knowing the scale starts at zero would be an important decision factor. 5-10%? 10-year yield inverted? I’d call that impactful, and the markets today seem to agree.
Difficult to predict which way this ‘asset’ will move. If it manages to cross the lower trending support line (not shown on the graph) then it would be indicative of a trend change. Also it would be nice to see other details such as the 50 and 200 day MAs, MACD and RSI.
In short, I would need more information before deciding on a trading strategy.
Interested to know what this asset might be?
Do you agree with the action Joe is looking at Chris?
Looking at the years, this looks like you have something terribly ordinary, but upside down. Climbing from the turn of the century ?
Spiking at the end of ’08 ? Peaking in early ’12 ?
This has to be Uranium ?