
 CLICK ON CHART TO ENLARGE
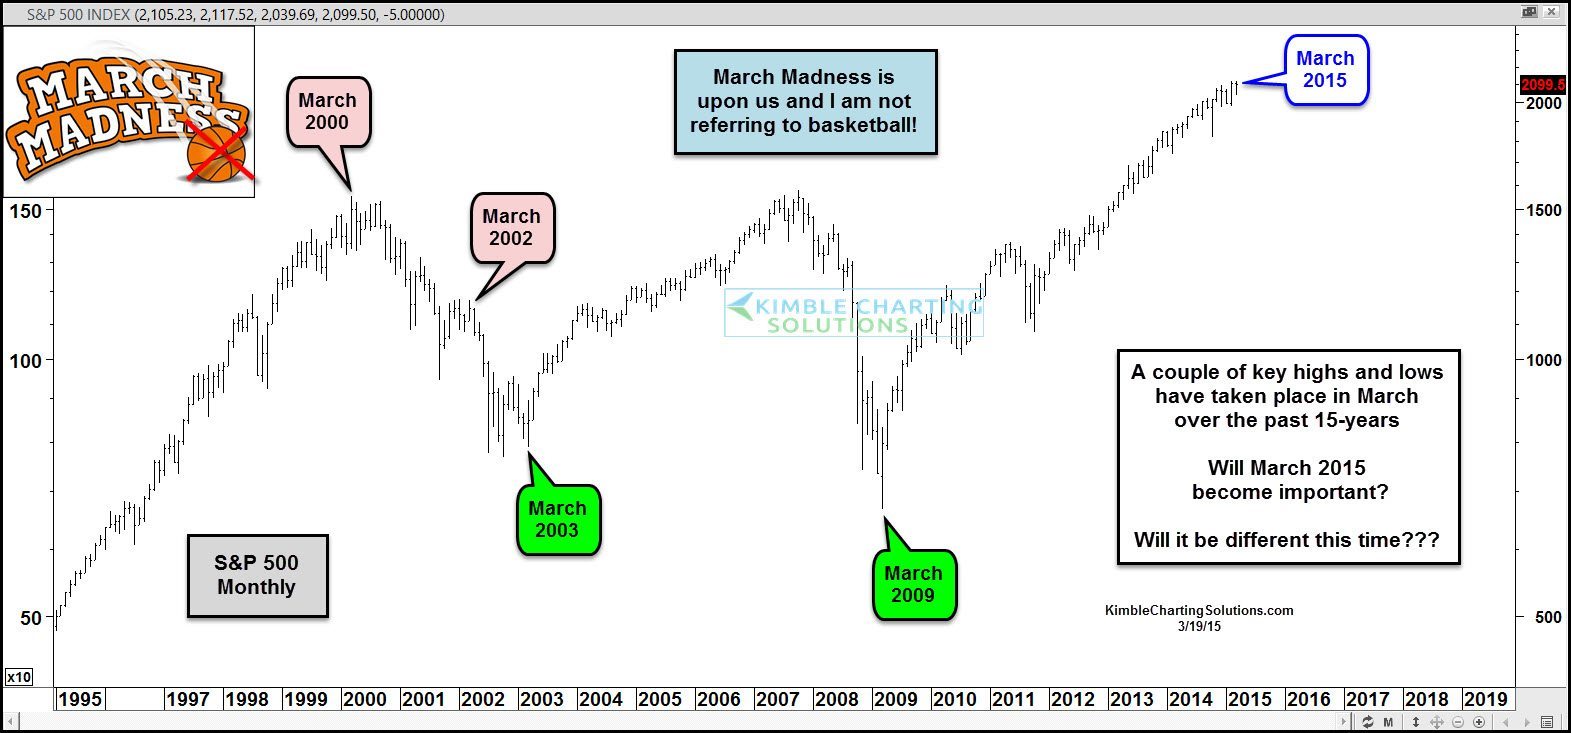
Do you have your March Madness bracket all filled out, its that time of year! Speaking of March Madness, for some reason a few key highs and lows have taken place in the month of March the past 15-years.
In 2000 and 2002, March became an excellent time to harvest long holdings in the broad markets, as sharp declines were about to take place.
In 2003 and 2009, March became an excellent time to go long the broad markets, as multi-year strong rallies were about to unfold.
Will March bring some madness this year? The chart below looks at the S&P 500, which reflects this is not your usual March when it comes to prices!
 CLICK ON CHART TO ENLARGE
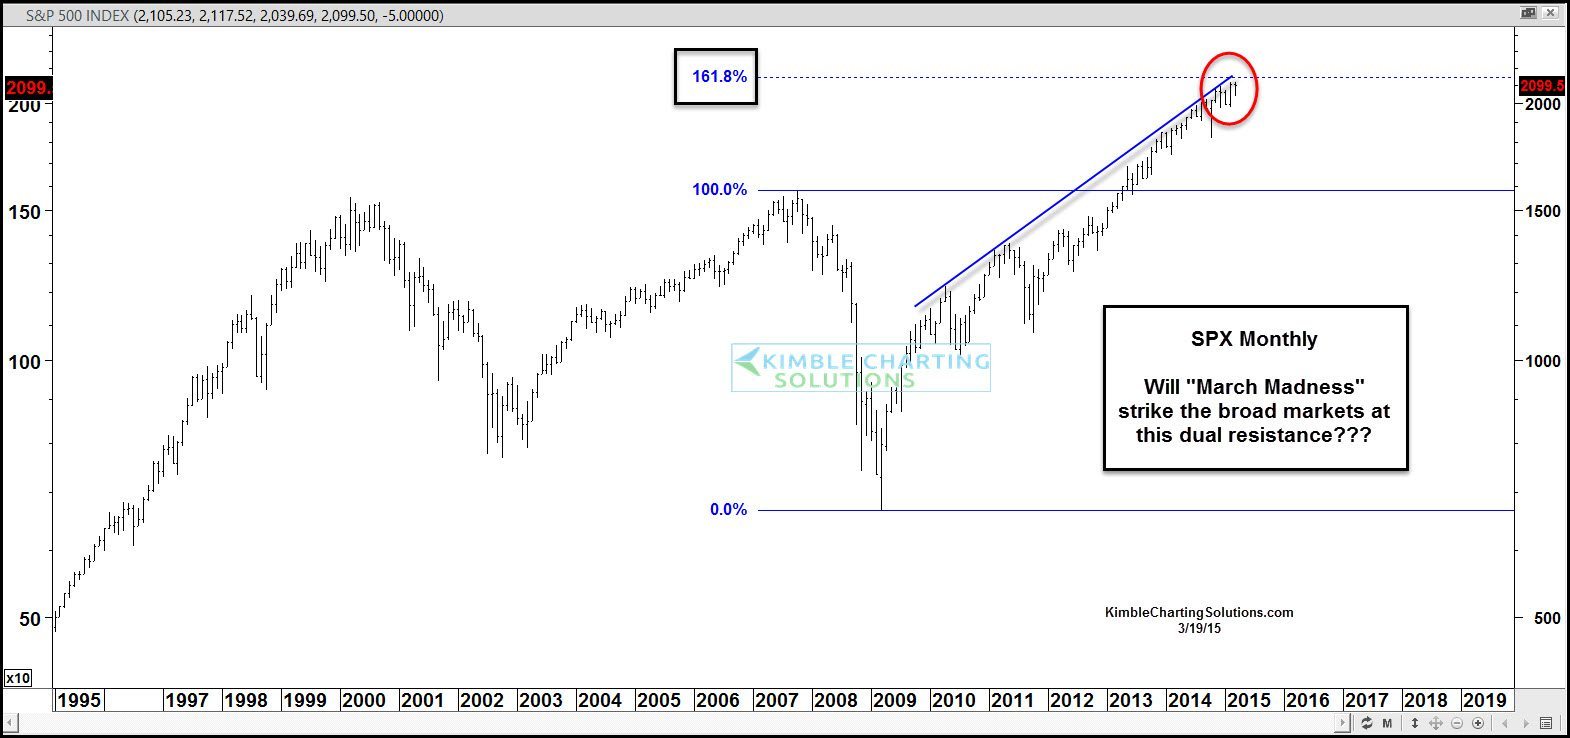
This chart takes the highs in 2007 and the lows in 2009 and applies Fibonacci to them. As you can see the S&P is facing dual resistance at this time (Fibonacci Extension and channel resistance).
Knowing why March as been a key month is above my pay grade, I don’t know why sometimes March becomes and important month. The only thing that matters is, while this March become a historical date.
Stay tuned friends and best wishes on your picks….in the tournament and in the markets!
Receive our research on a Daily or Weekly Basis…Click below for full details and opportunities

–
