
 CLICK ON CHART TO ENLARGE
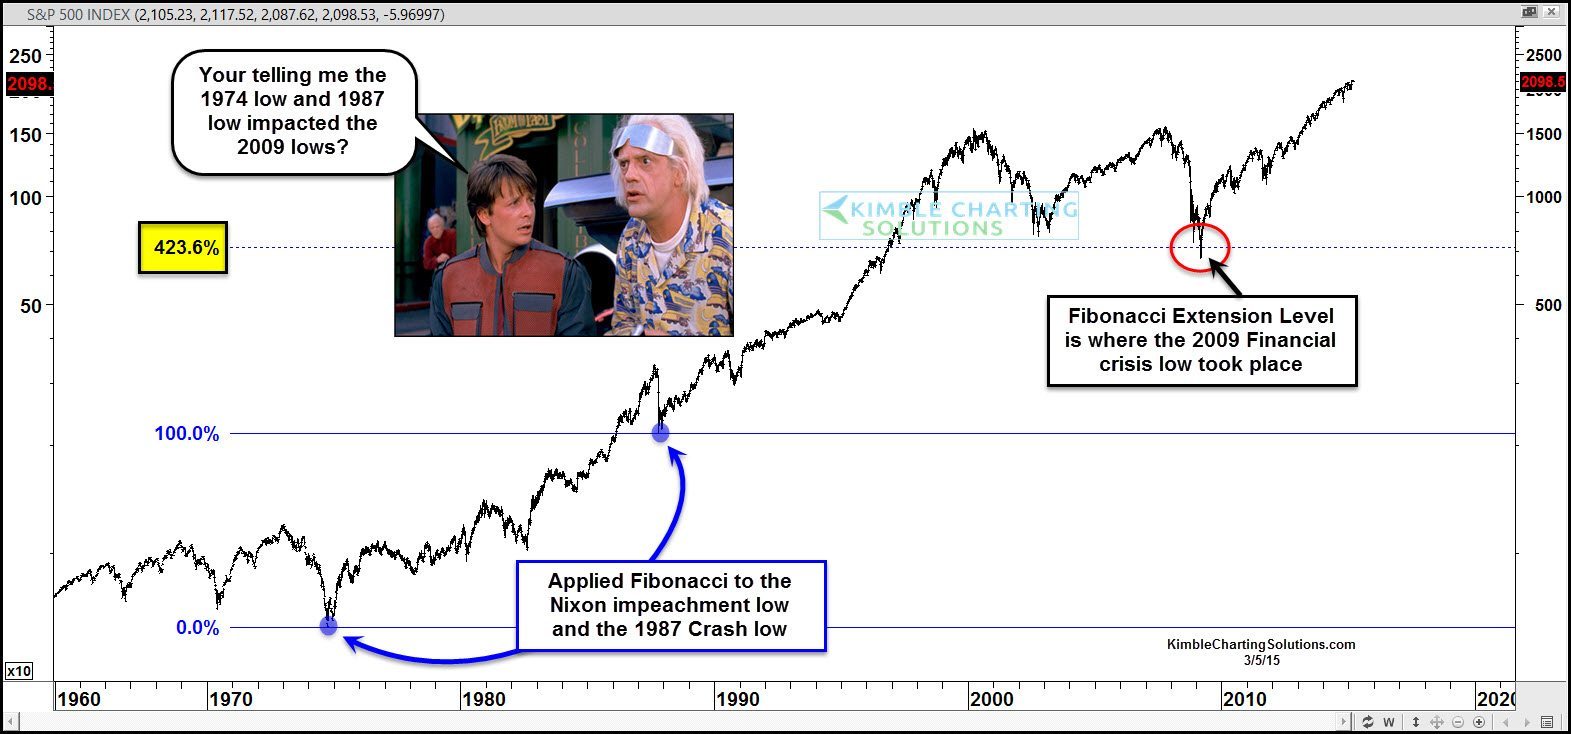
Could our past impact the future? First off let’s see if it has in the past! The above chart is a long-term view of the S&P 500. 1974 was a key low, it took place around the time President Nixon was impeached. Most are aware that that a very sharp decline took place in 1987. I applied Fibonacci to these key lows and the financial crisis low in 2009 took place right at the 423% Fibonacci extension level, based upon these key dates.
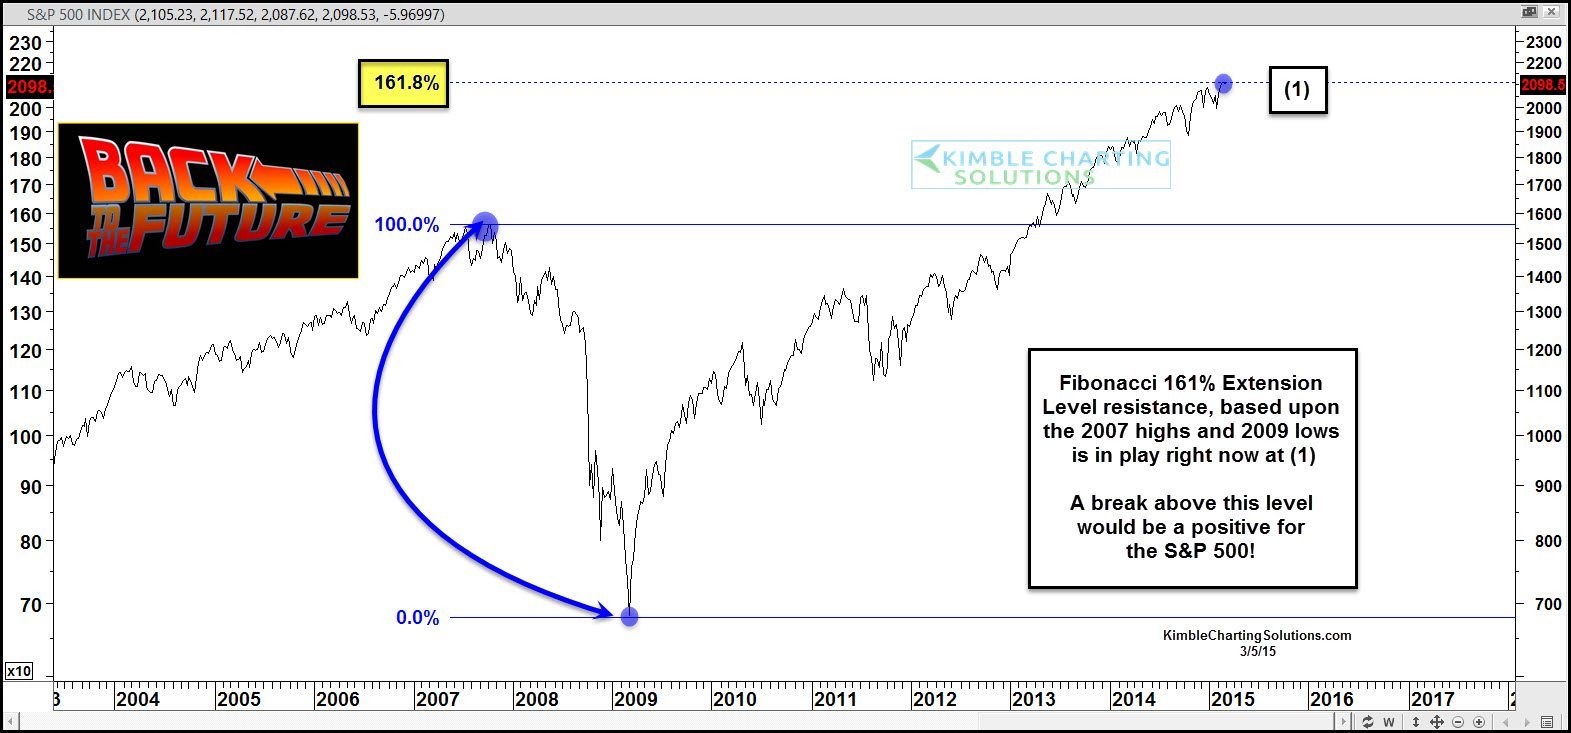
In the chart below I did something similar to the chart above. I took the S&P 500 and applied Fibonacci to the 2007 highs and 2009 lows.
 CLICK ON CHART TO ENLARGE
As you can see above, the S&P 500 right now at (1) is facing the Fibonacci 161% extension levels based upon the key high in 2007 and low in 2009. This level has the potential to become resistance. Watch the price level closely. In my humble opinion, the most important point here is this, should the S&P 500 break above the 161% level, it would be a very important breakout!
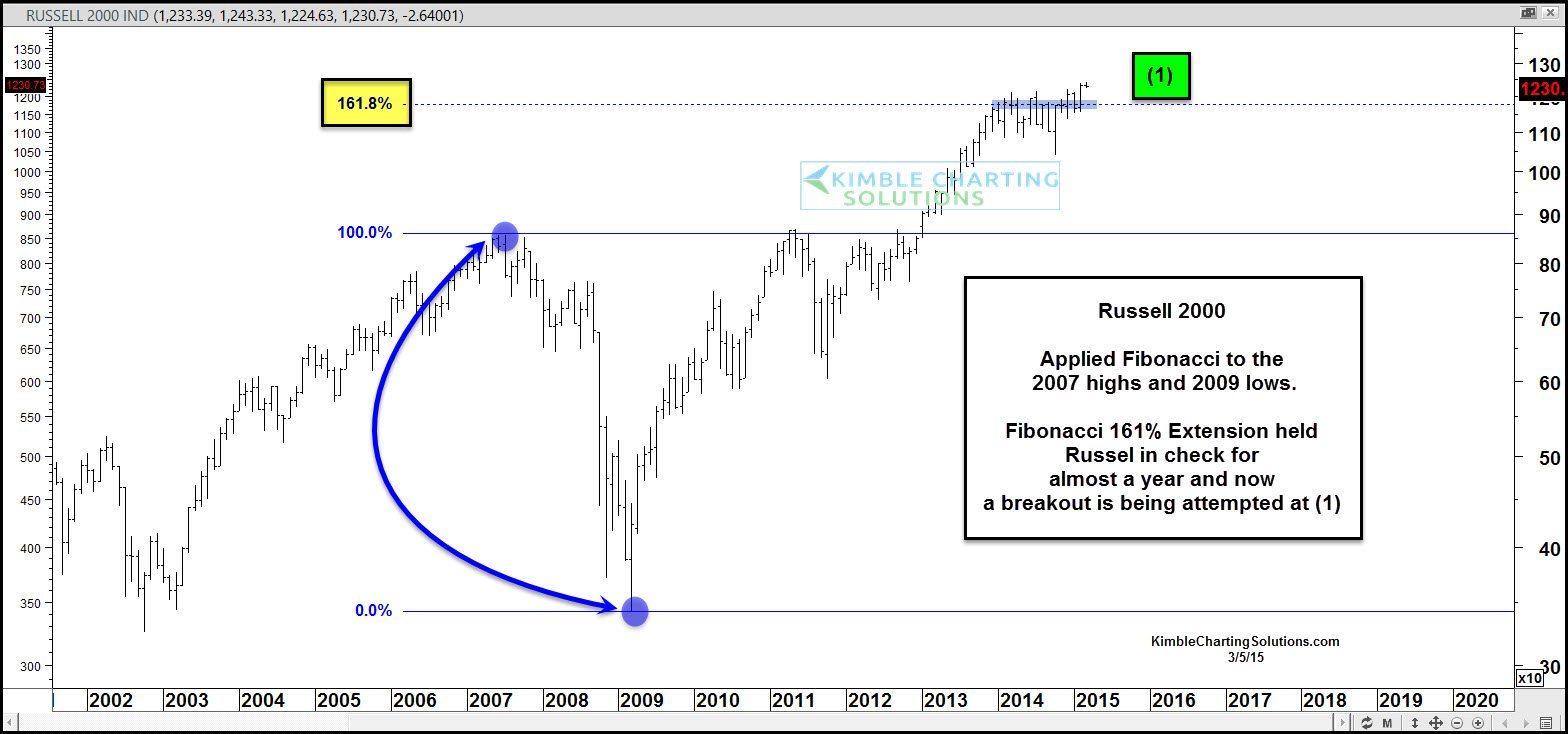
In the chart below, I applied the Fibonacci to the same dates as the S&P 500 above (2007 high/2009) lows.
 CLICK ON CHART TO ENLARGE
As you can see, once the Russell hit the 161% zone, it became resistance for about a year. Of late the Russell is now working on a breakout of this one year sideways choppy pattern. A break above this level should be considered a positive.
Bottom line – The S&P 500 is presently facing a key resistance point, based upon key levels in the past. Resistance is resistance until broken if broken. If a breakout takes place the S&P 500, the next key Fibonacci extension level is a large percentage above current prices!
I would be honored to have you as a daily or weekly member if this type of chart analysis is of interest to you. Click below for details

–
