
 CLICK ON CHART TO ENLARGE
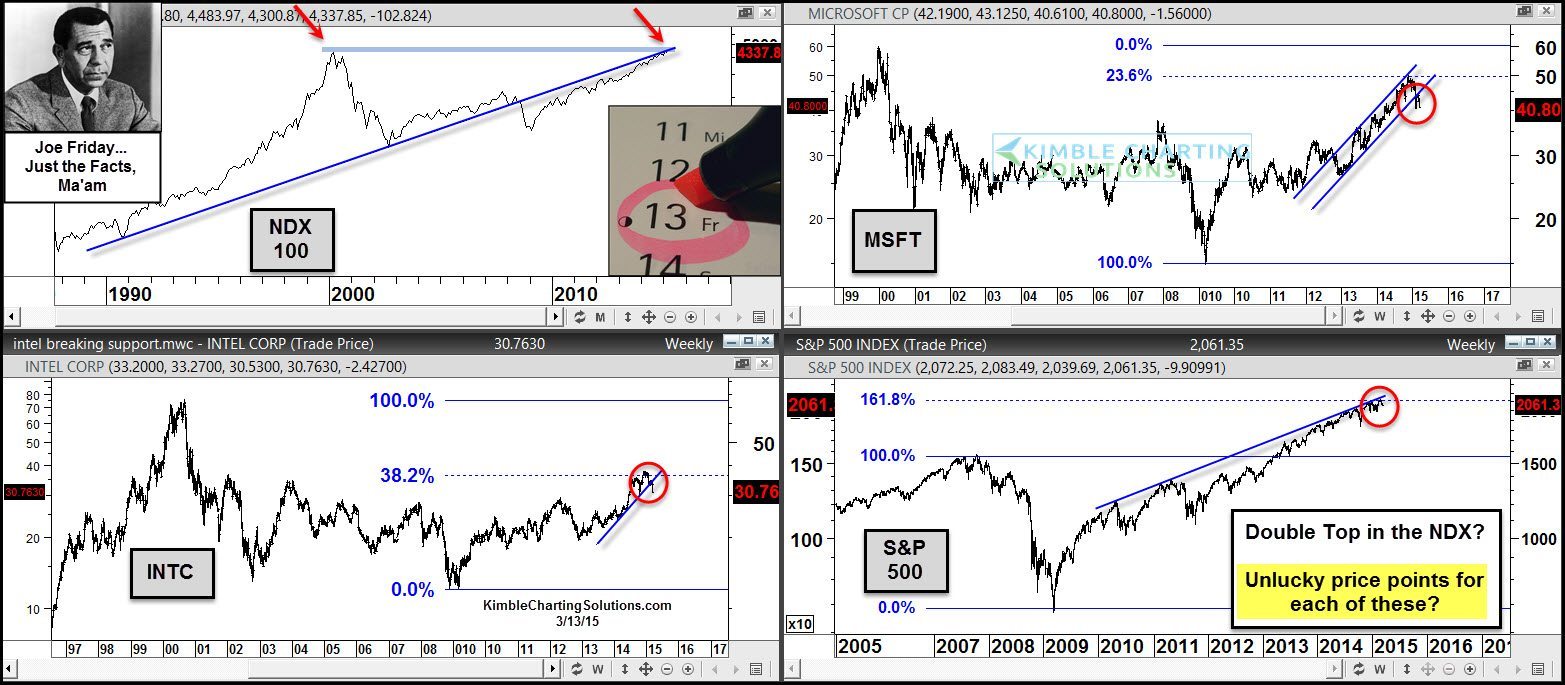
The upper left chart looks at the Nasdaq 100 on a monthly basis. Could a double top be taking place?
Microsoft and Intel both met very long-term Fibonacci resistance levels and have since broken below support.
The S&P 500 finds itself at a key long-term Fibonacci extension at the same time (lower righ chart)
Joe Friday, just the facts….Further weakness at these price points could be unlucky for each these assets.
–
