
 CLICK ON CHART TO ENLARGE
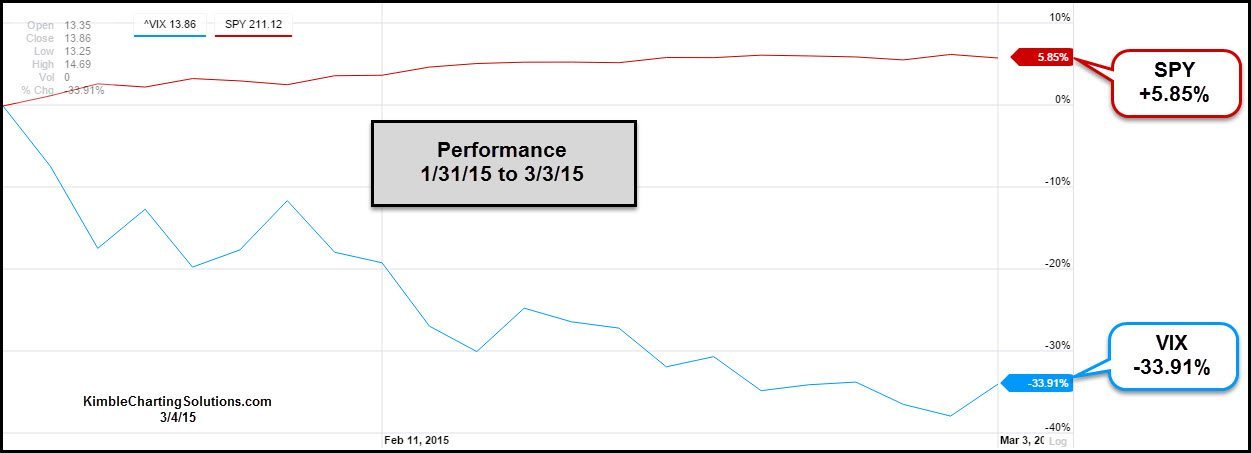
The chart below looks back on the past 31 days and reflects that the S&P 500 did well (up over 5%). During this rally, investors confidence grew and fear levels fell hard (over 30%).
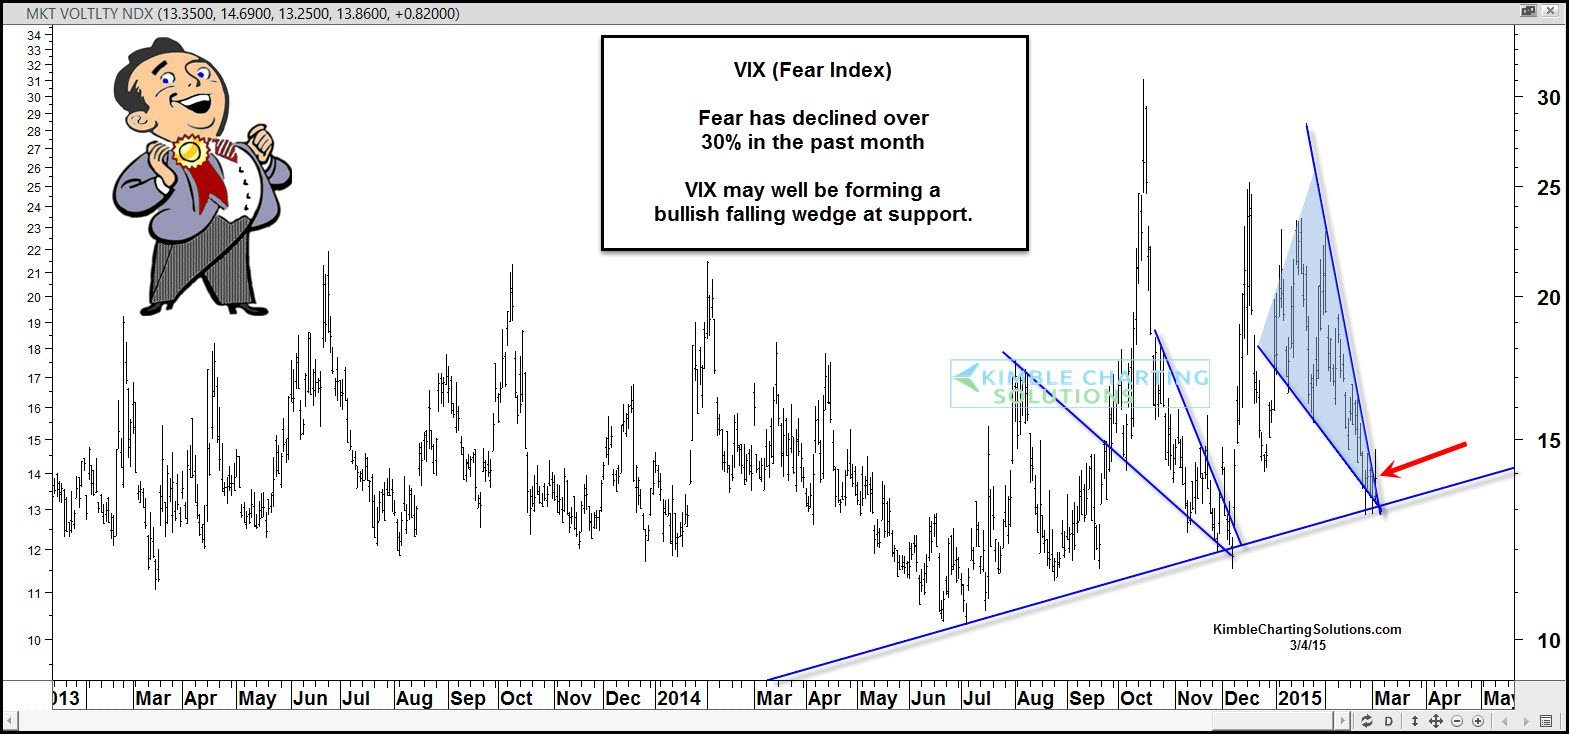
The above chart takes a look at the VIX index, which appears to be forming a bullish falling wedge, with the apex of the wedge pattern coming into play as the VIX index is hitting rising support.
 CLICK ON CHART TO ENLARGE
Falling wedges suggest than an asset will rally around 65% of the time. The top chart shows that the VIX index created a bullish falling wedge in late 2014. Once the VIX broke the upside of the bullish pattern, it rallied 100% in 11 days! During this VIX rally, SPY fell just under 5%.
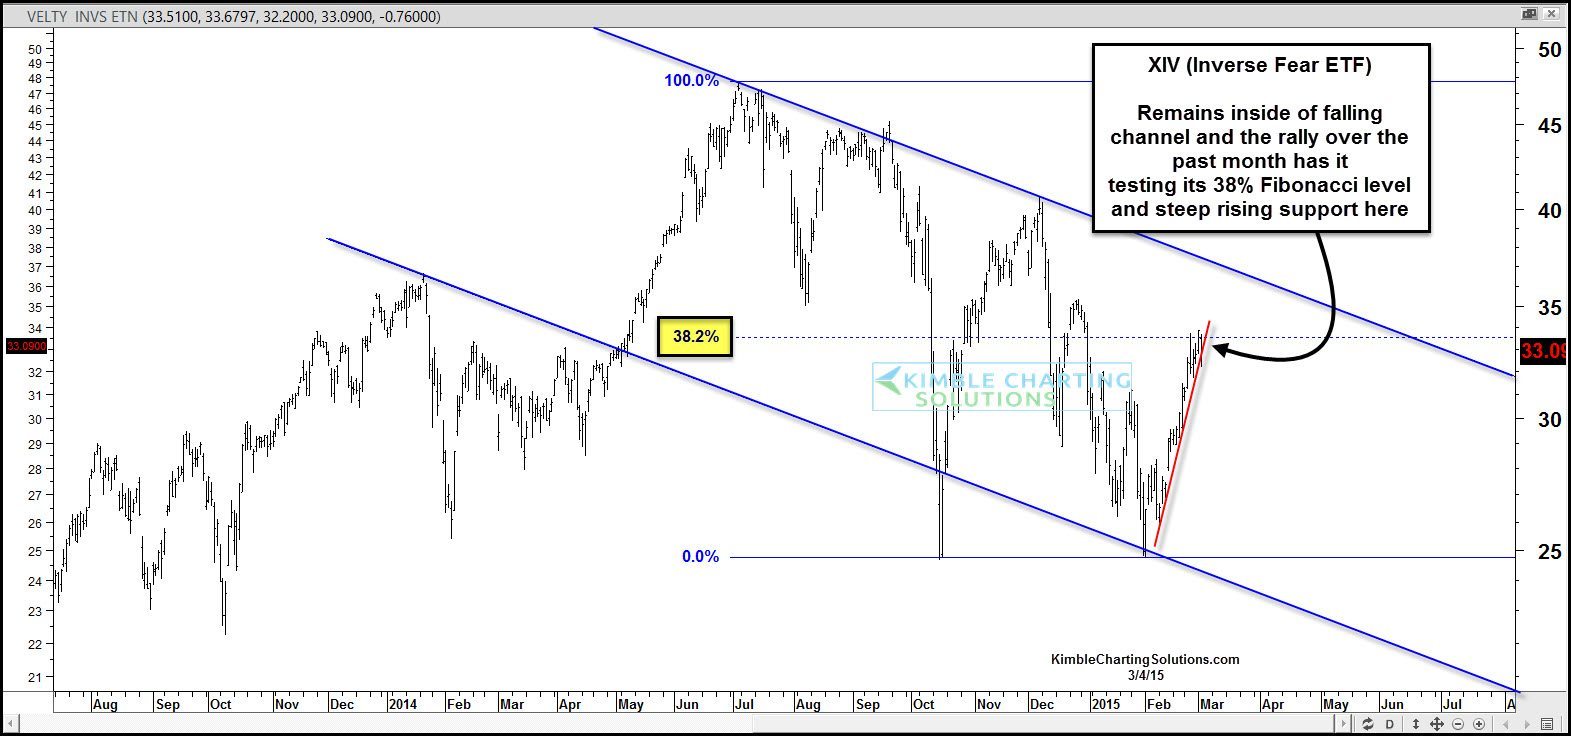
The chart below highlights a sharp rally in the inverse fear ETF XIV. It has had a sharp rally over the past month, after it looked to have created a double bottom. XIV remains inside of a falling channel and is testing its 38% Fib level.
 CLICK ON CHART TO ENLARGE
Some extreme moves in fear levels have taken place in the past month. If the VIX index breaks above resistance of the bullish falling wedge or XIV breaks below its steep rising support line, they would be suggesting that fear levels are due to rally in the short-term.
Full Disclosure- Premium Members have owned XIV over the past few weeks and are harvesting positions are Fib resistance
If you would like to receive daily research on trading these fear ratios, I would be honored to have you as a premium member, sign up details can be found by clicking below

–
