

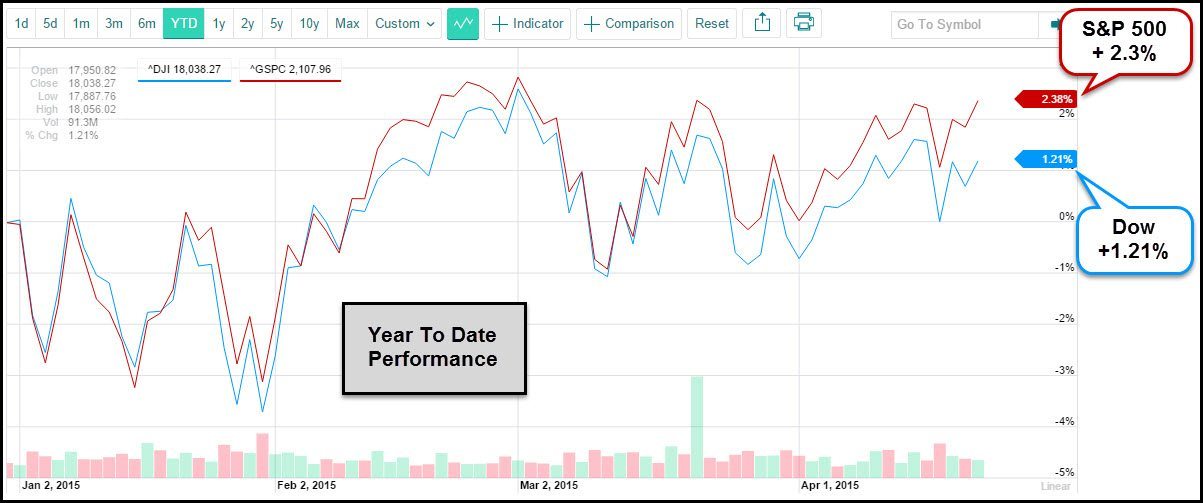
When it comes to the Dow and S&P 500 this year, have you found yourself yawning of late? I have, as its been a pretty boring year for both of these indices. The chart below reflects that over 100 days have passed and the S&P is up just over 2% and the Dow is up just over 1% (see chart below).
 CLICK ON CHART TO ENLARGE
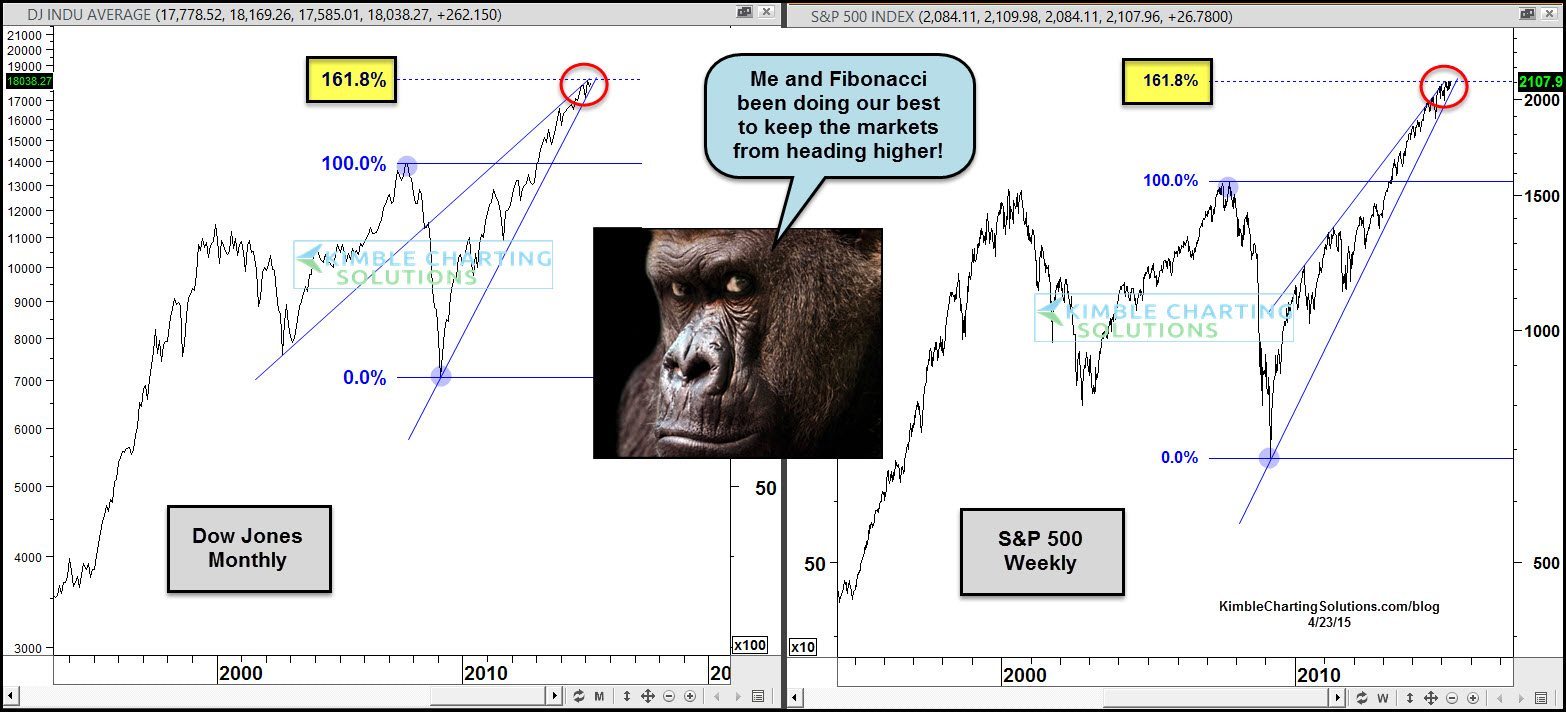
Can we point a finger as to why the markets have been doing nothing more than marking time? The chart below looks at the Dow and the S&P 500 over the past 20 years. I applied Fibonacci to the 2007 highs and 2009 lows for each and looked at extension levels.
 CLICK ON CHART TO ENLARGE
As you can see above, both are attempting to break above 800 Pound Fibonacci 161% Extension levels at the same time! How these markets resolve this breakout attempt, could tell us a good deal about where the markets are weeks to months from now.
Did someone say “Sell in May and Go Away?”
These Fibonacci extension levels could have much to say about breakouts by these key markets!
–

Chris, Great point. I noticed this on my charts on the SPX and you’re the first credible source to point out the 161.8 levels.
Thanks for the write-up. I have also been bored with the toing and froing of the indices of late. As you said we night get a strong directional move in the holiday months. Hopefully…