CLICK ON CHART TO ENLARGE
Few sectors have been hotter over the past few years than Bio Tech.
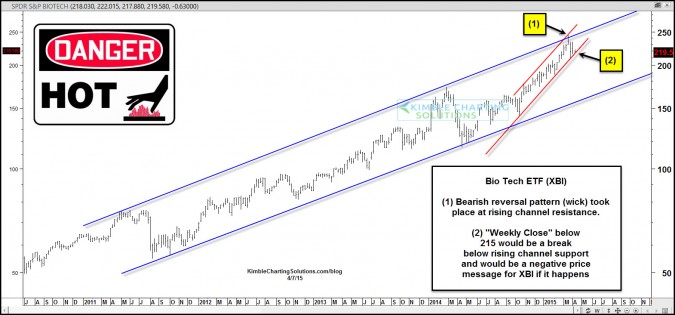
On the week ending 3/20, XBI created a reversal pattern (bearish wick) at the top of its multi-year rising channel at (1). Since then XBI has been a little soft, where it is testing rising support this morning at (2).
The chart below takes a look at the largest reversal pattern in IBB history that took place last month at Fibonacci Extension resistance with momentum at the highest monthly level in history.
I remain of the belief that it can enhance portfolio returns by keeping a close eye on leadership. Support is support until broken.
With the S&P 500 nearly flat on the year, this support test at (2) in the hottest of the hot is pretty important!
–


