
CLICK ON CHART TO ENLARGE
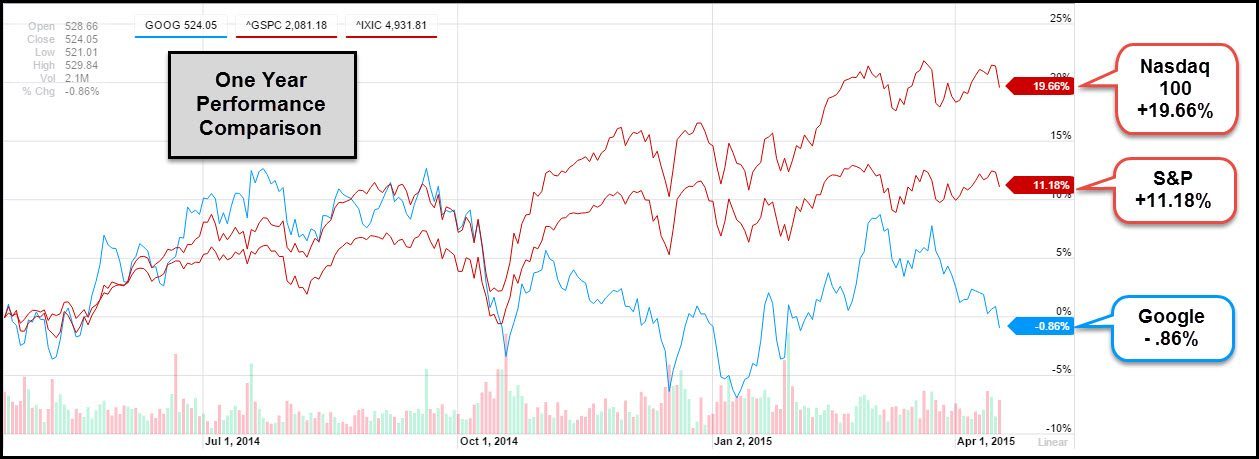
Google has had a disappointing year when comparing it to the S&P 500 and other tech stocks. As you can see above, it has under performed the Nasdaq 100 index by nearly 19% and it has lagged the broad market by more than 10% in the past year.
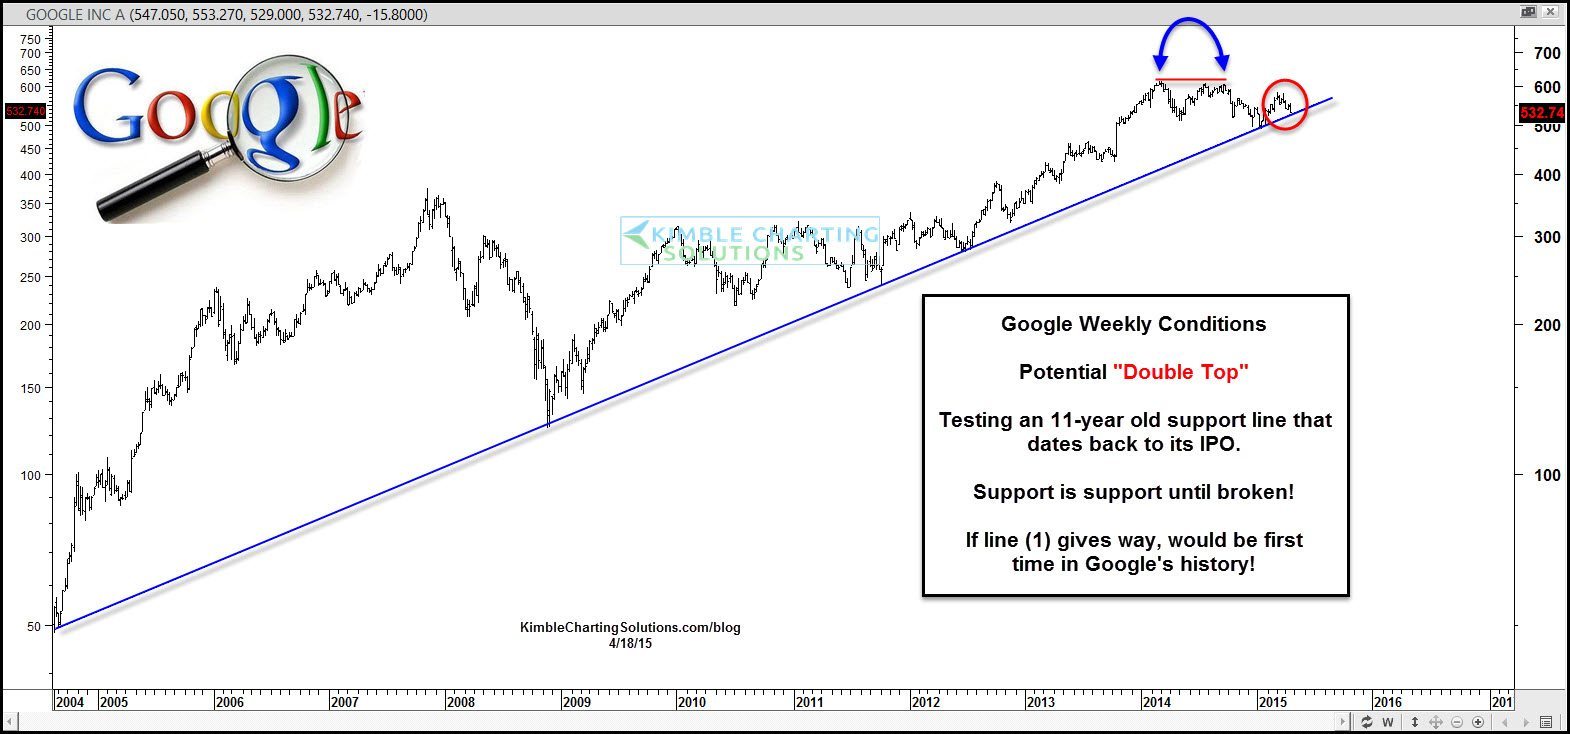
Did Google create a double top over the past year, prior to this under performance? The jury is out on this question at this time.
This under performance by Google now has it testing a support line that dates back to its IPO price over a decade ago.
 CLICK ON CHART TO ENLARGE
Support is support until broken and so far it has paid to buy Google on this support line since 2008.
The long-term support line isn’t the only key test for Google at this time! Below is the Nasdaq 100/Google ratio.
 CLICK ON CHART TO ENLARGE
The ratio has been moving sharply higher over the past year, reflecting strength by tech stocks compared to Google. The ratio is now testing falling resistance.
These charts suggest Google is facing a very important price point at this time. So far it has paid to buy Google on support for nearly a decade, will it be different this time?
–
