
 CLICK ON CHART TO ENLARGE
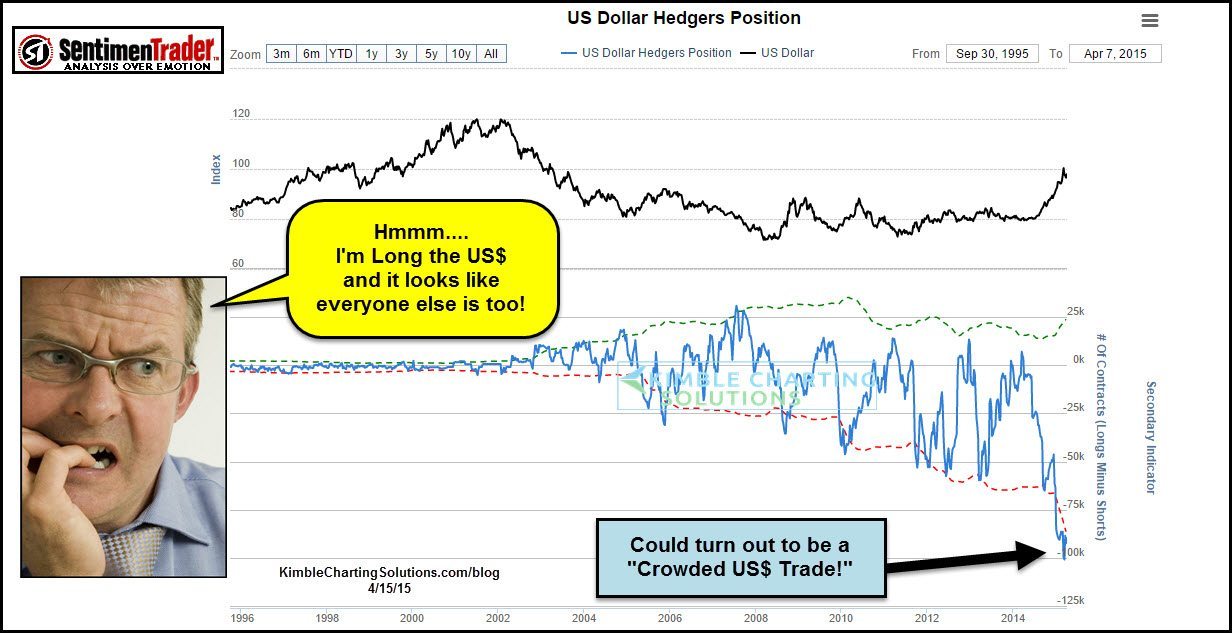
The above chart from Sentiment Trader, reflects that a ton of investors have established long positions in the U.S. Dollar. This chart reflects that traders have established the most unique positions in the U.S. Dollar in the past 20 years. Being long King Dollar for the past year has been the right trade for darn sure.
Could this trade now be long in the tooth? Time will tell. What this chart does reflect is this…Should King Dollar happen to retreat a little in price, a good number of investors would be caught on the wrong side.
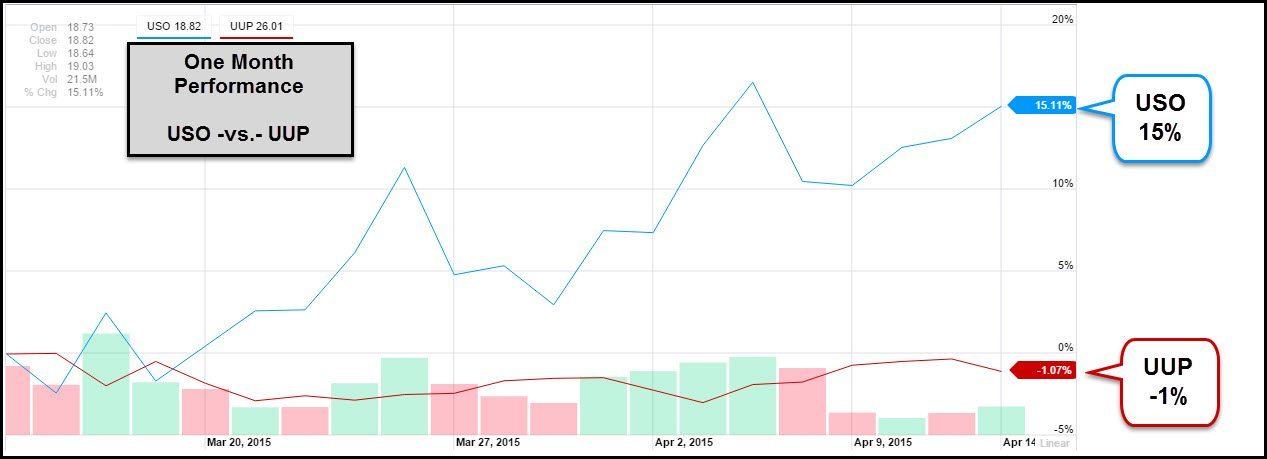
What has the last month been like for the US$? Does it feel like its up? I would understand if you’d said yes. The chart below looks at the last months performance of the US$ and Crude Oil.
 CLICK ON CHART TO ENLARGE
As you can see, in the past 30 days, the US$ is flat and hard hit Crude Oil is up 15%. This would reflect a good deal of strength by Crude Oil in the face of the Dollar in this time frame.
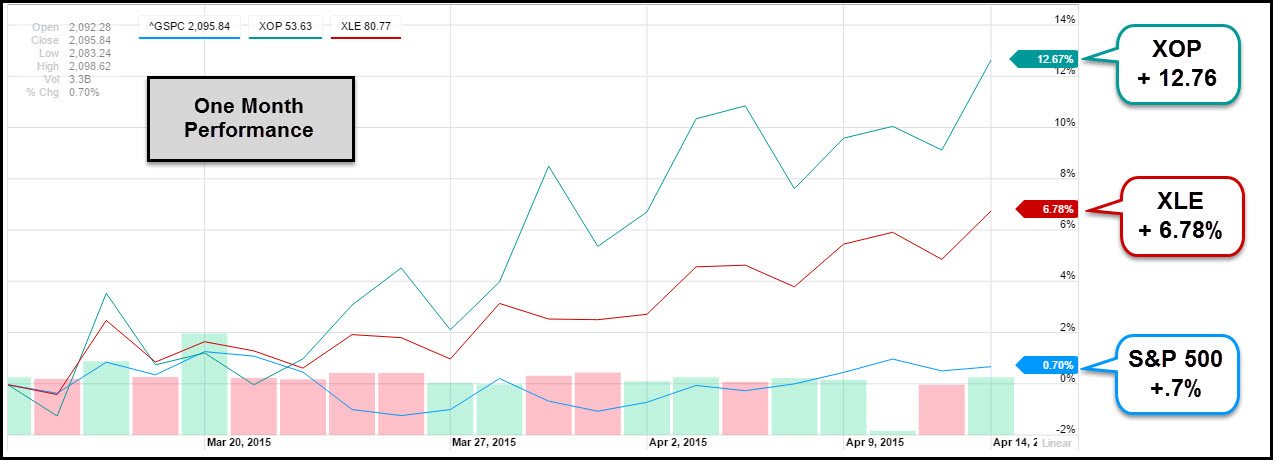
The chart below looks at the S&P 500, compared to two different oil plays over the past 30-days.
 CLICK ON CHART TO ENLARGE
Not only is the US$ flat over the past 30-days, the S&P 500 is too! These two oil plays are reflecting relative strength compared to the broad market of late.
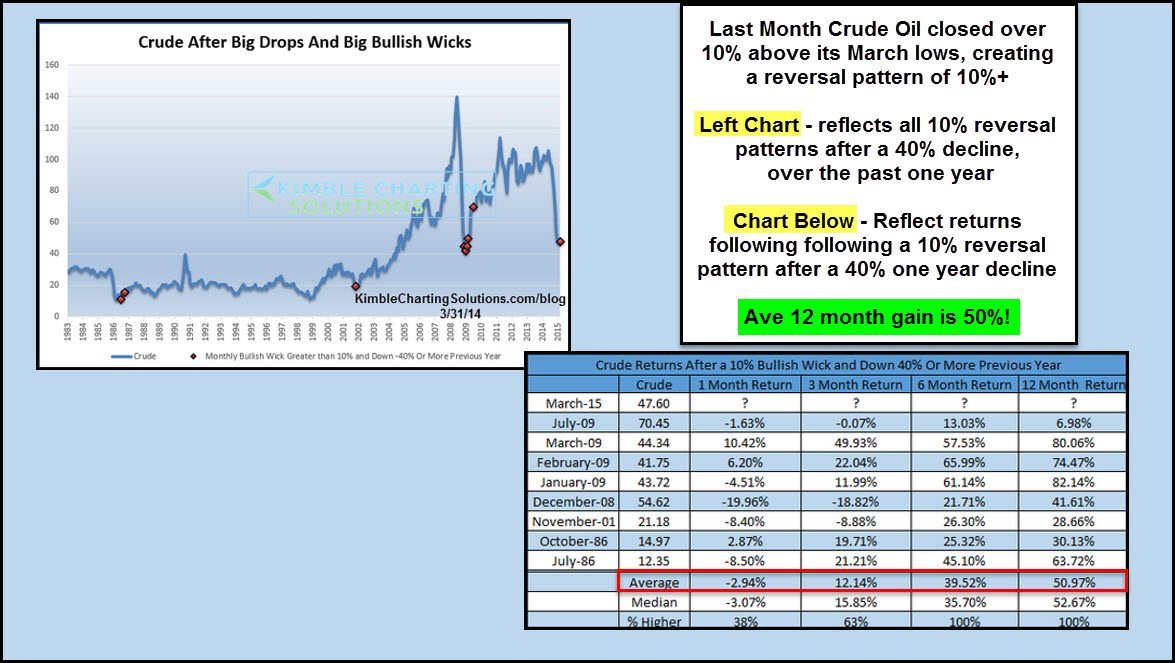
The Power of the Pattern shared on 3/31 the table below, reflecting what Crude Oil has done when it creates a reversal pattern, following a 40% decline in the past 12 months.
 CLICK ON CHART TO ENLARGE
Humbly, I don’t know if Crude will repeats its average 50% gain over the next year, as the table shares above.
I find the results of Crude Oil and several energy plays over the past few weeks encouraging for this sector. For sure damage has taken place here. If you like the idea of buying low and selling higher, might want to keep a close eye on this sector!
–
