
 CLICK ON CHART TO ENLARGE
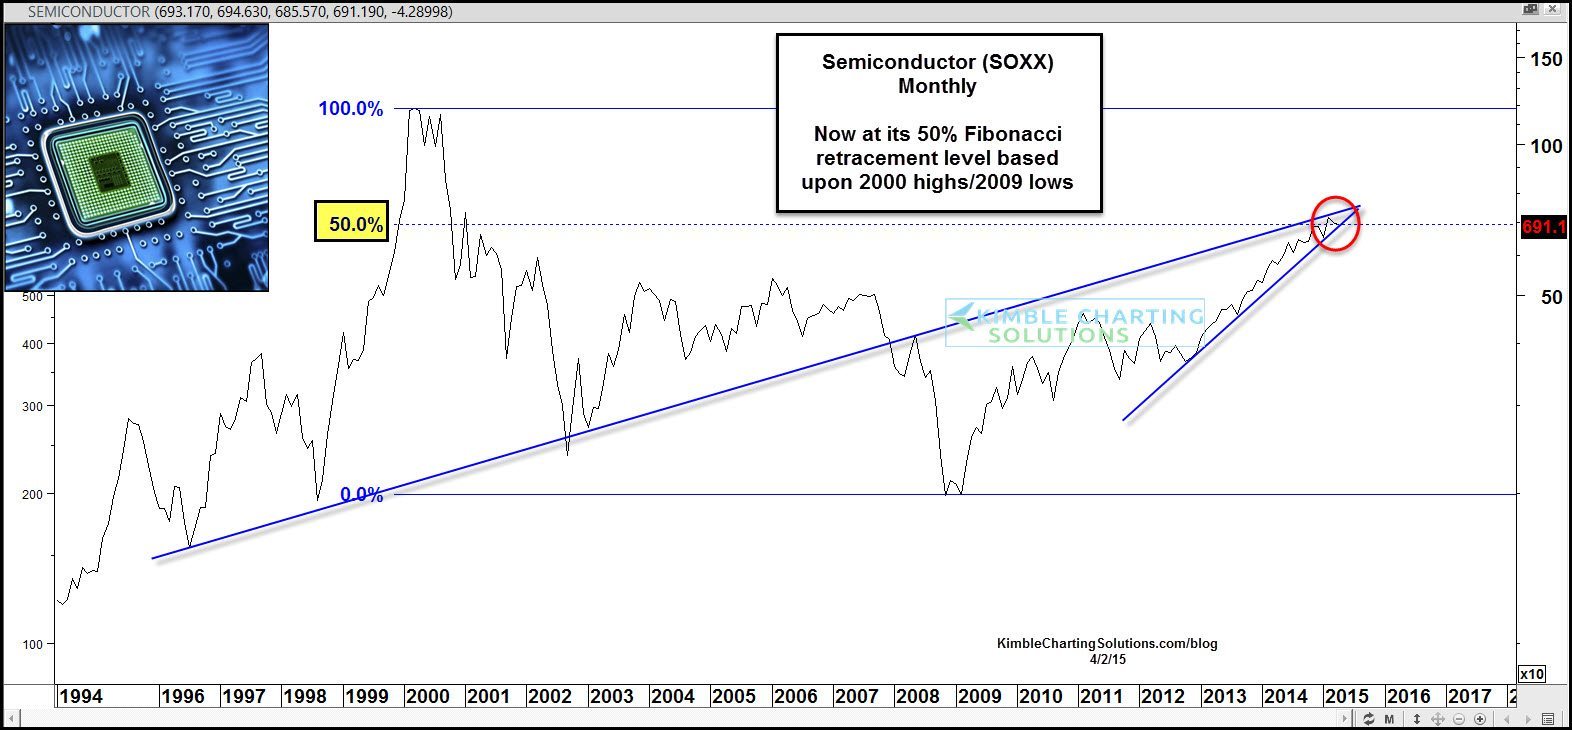
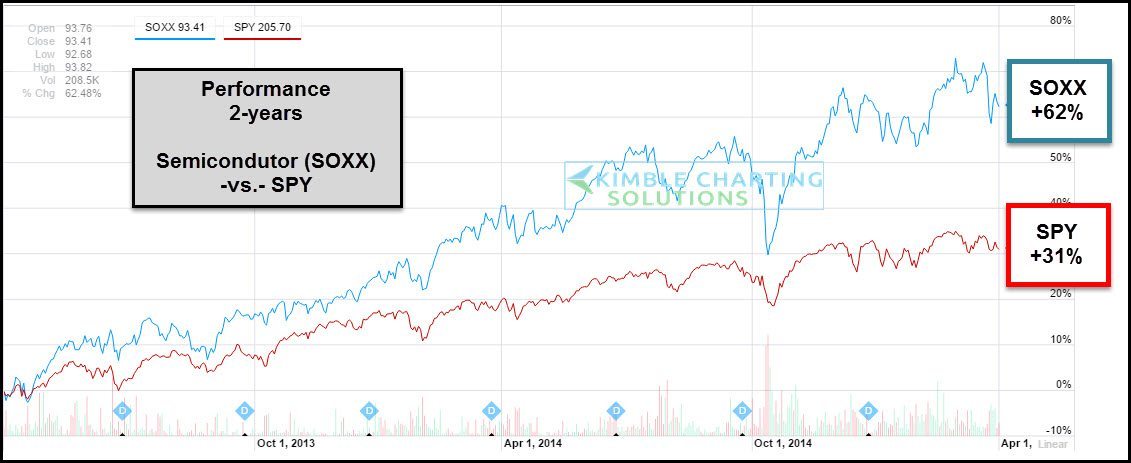
Over the past two years the Semiconductor Index (SOXX) has done really well. The chart below reflects that it has gained 62%, which doubled the performance of the S&P 500. The rally over the past two years has pushed the SOXX index up to its 50% Fibonacci retracement level based upon its 2000 highs and 2009 lows.
SOXX faces a potential key test to its upward trend in the chart above as a resistance line is now in play at the 50% Fib level that is based upon key reversal points in the index dating back 20 years.
 CLICK ON CHART TO ENLARGE
No doubt the trend in the SOXX is up at this time. Keep a close eye on this trend, because a key test of 3-year support is at hand at the same time that resistance is being tested.
How the SOXX index handles this dual test could influence the broad markets….Stay tuned to message coming from the SOXX index!
More Power of the Pattern Research can be found by clicking below…

