
CLICK ON CHART TO ENLARGE
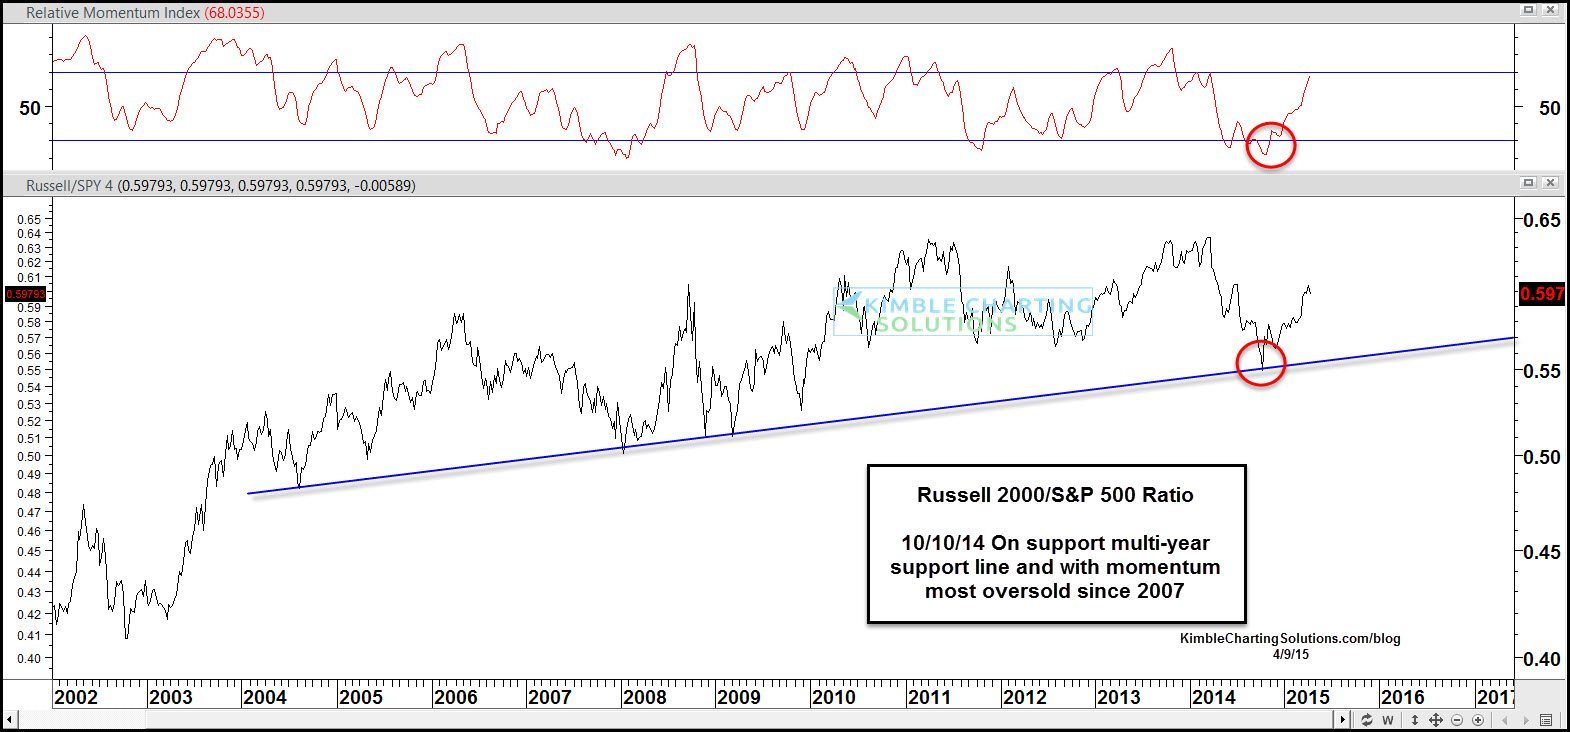
The Power of the Pattern shared last October that the Russell 2000/S&P 500 ratio was on multi-year support, as small caps had been weaker than large caps for the prior 10-months. The ratio on support was suggesting this pair trade- Long Russell 2000/Short S&P 500.
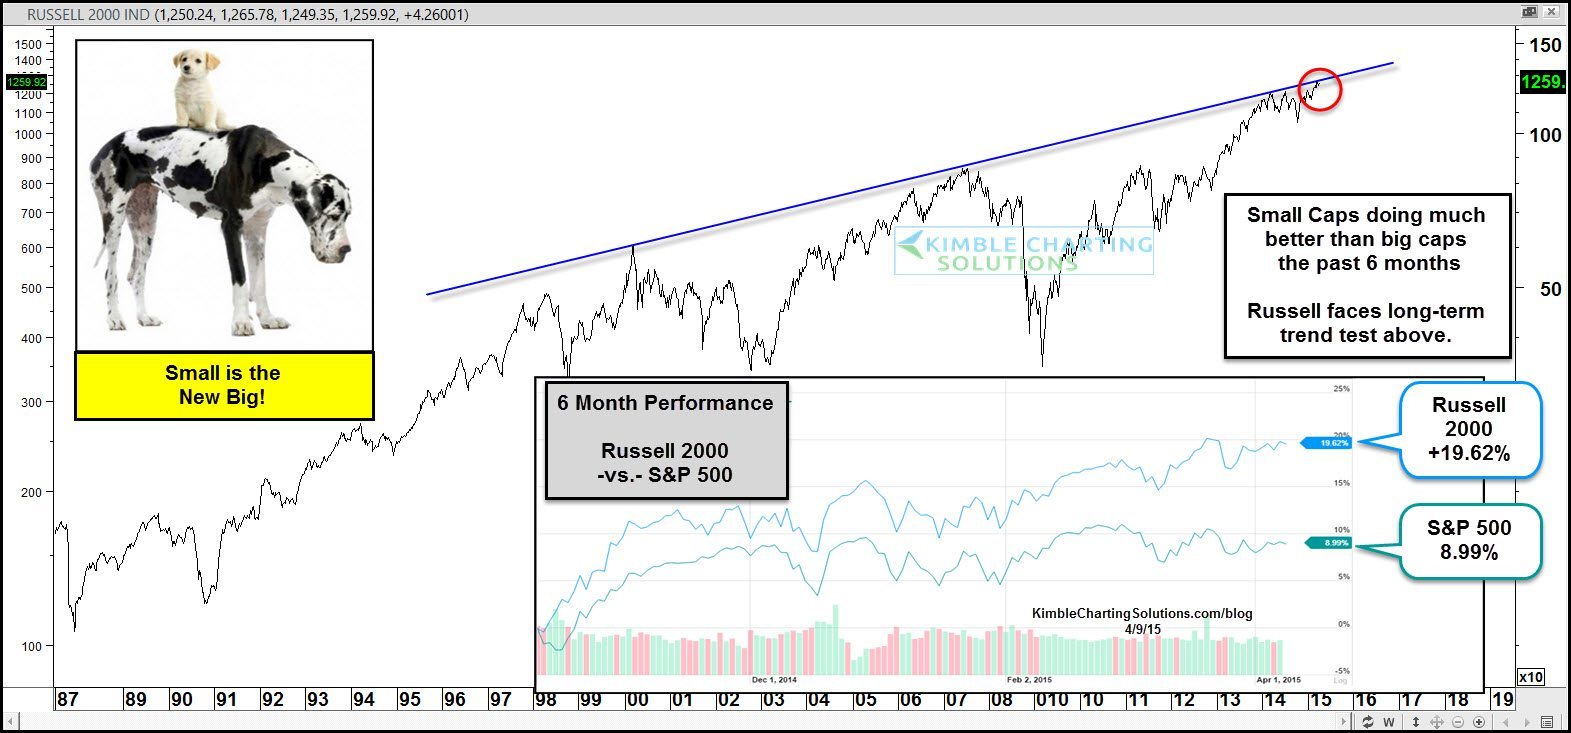
The lower right inset chart reflects that Small Caps have out performed large caps by nearly 11% in the past 6 months.
Below is an update on the Russell 2000/S&P ratio. As you can see Small has been the new big since October. Now momentum is getting lofty.
CLICK ON CHART TO ENLARGE
Key to the top chart…The Russell 2000 is now facing a very key resistance test above, tied to its highs in 1998 and 2007, with the Russell/S&P ratio reaching lofty levels.
What the Russell does at this resistance line could tell us a ton about where Small Caps could be months from now.
To become a member, click below for details 
