
 CLICK ON CHART TO ENLARGE
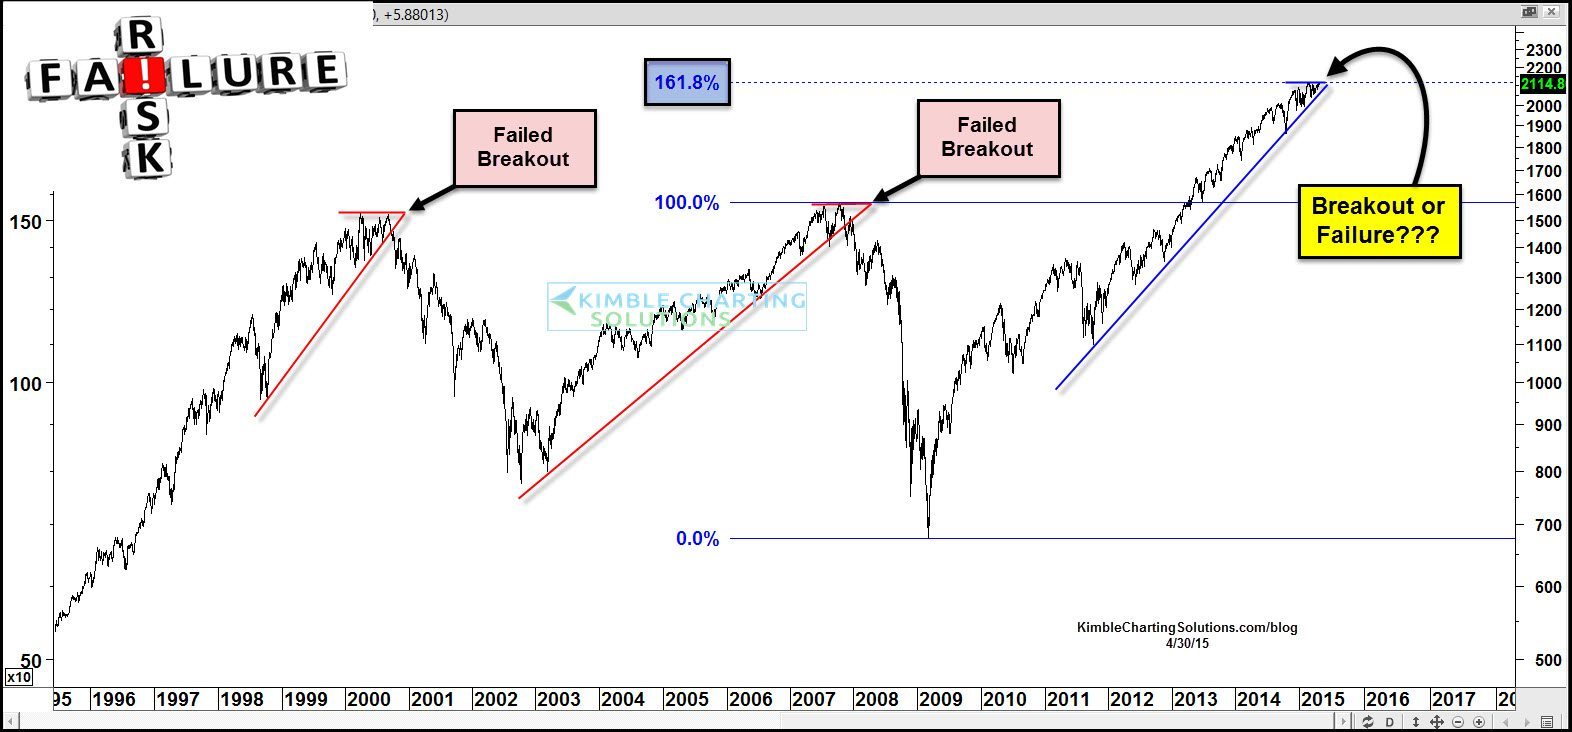
In 2000 and 2007 the S&P created bullish ascending triangle patterns, which two-thirds of the time suggest higher prices are ahead. The key to this pattern is support holding. Both times multi-year support failed to hold and you know the rest of the story.
Now the S&P appears to be creating the same pattern again, at 161% Fibonacci extension resistance.
In 2000 & 2007, what the S&P did at support was very important!
In my humble opinion, what the S&P does at support right now is very important too!
You can receive our research on a Daily or Weekly Basis…Click of details

–
