
 CLICK ON CHART TO ENLARGE
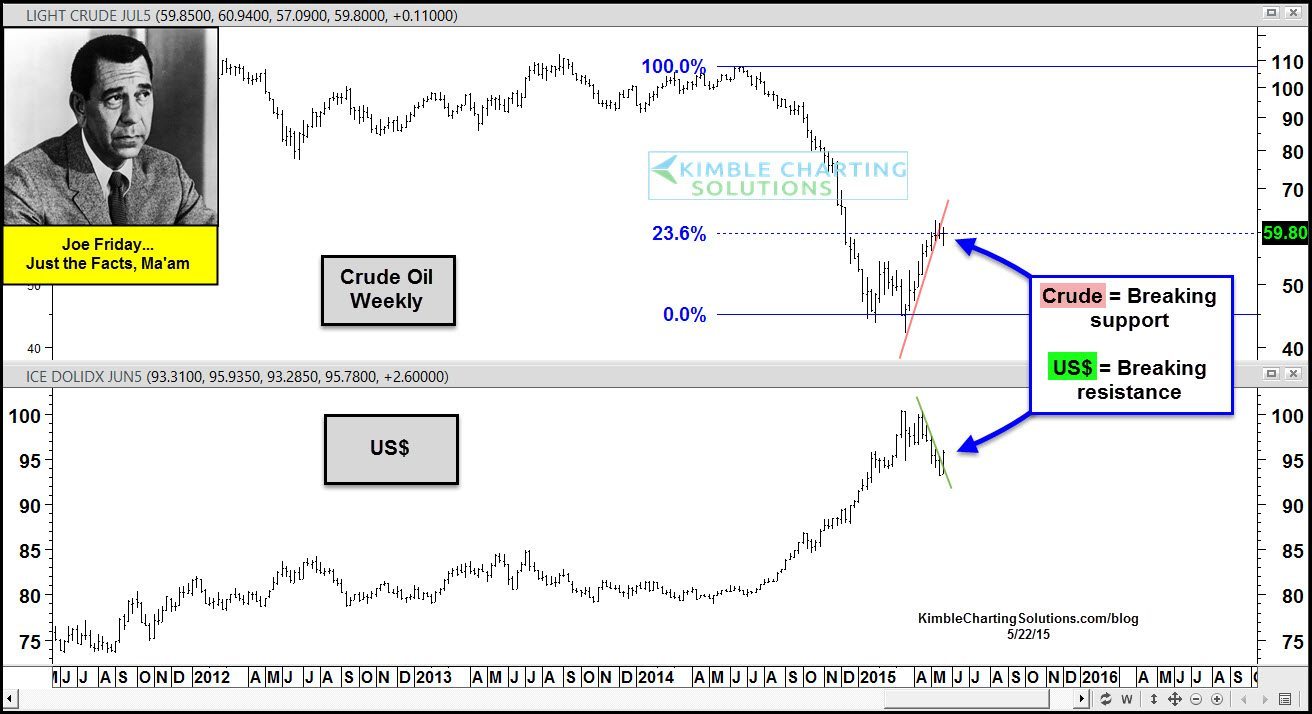
King Dollar and Crude Oil have been have had little correlation over the past year, as each has traded in pretty much opposite directions.
Over the past 9 months King Dollar has had a historical rally and the opposite is true for Crude Oil.
Of late Crude hit its 23% Fibonacci resistance line, based upon last summers weekly closing highs and weekly closing low on 3/13/15.
Joe Friday just the facts….Crude oil is making an attempt to break short-term steep rising support this week and King Dollar is attempting to break short-term steep falling resistance.
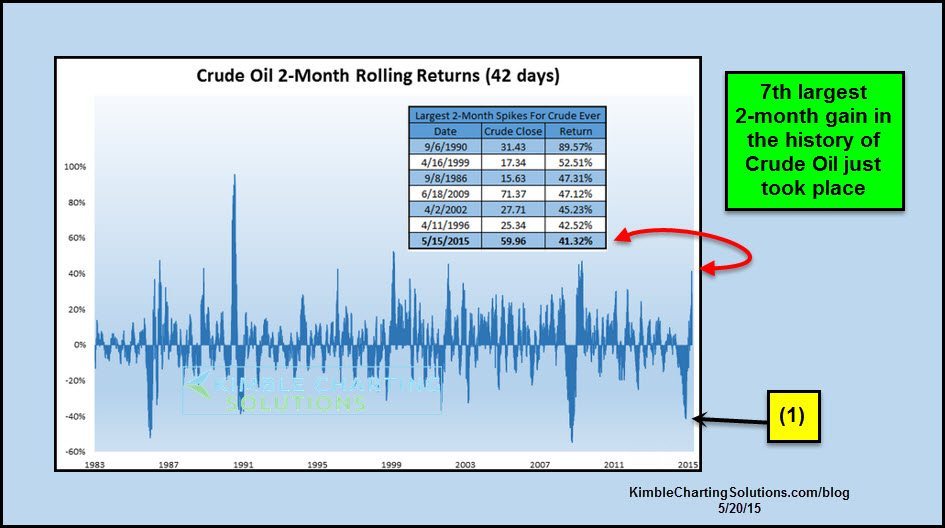
Crude oil just experienced its 7th largest 2-month rally in its history (See post here) reflected in the chart below.
 CLICK ON CHART TO ENLARGE
Could it be a time for Crude Oil to cool off a little???
To receive daily research sent to your in box (CLICK HERE).
To receive weekly research sent to your in box (CLICK HERE)
–

Great update.
Everyone keeps saying this market is about to crash, what a load of crap.
Have a look at this guy from the US, his calls on the market have been killer and rediculously accurate ==> http://bit.ly/1B4K0wk
He is saying we are about to ROCKET higher on the stock market!
And to think I listened to those dummies from CNBC say the EARNINGS season was gunna be HORRIFIC!!! those buggers….I have been had yet again!! Pack
of liars….pissed me off!