
 CLICK ON CHART TO ENLARGE
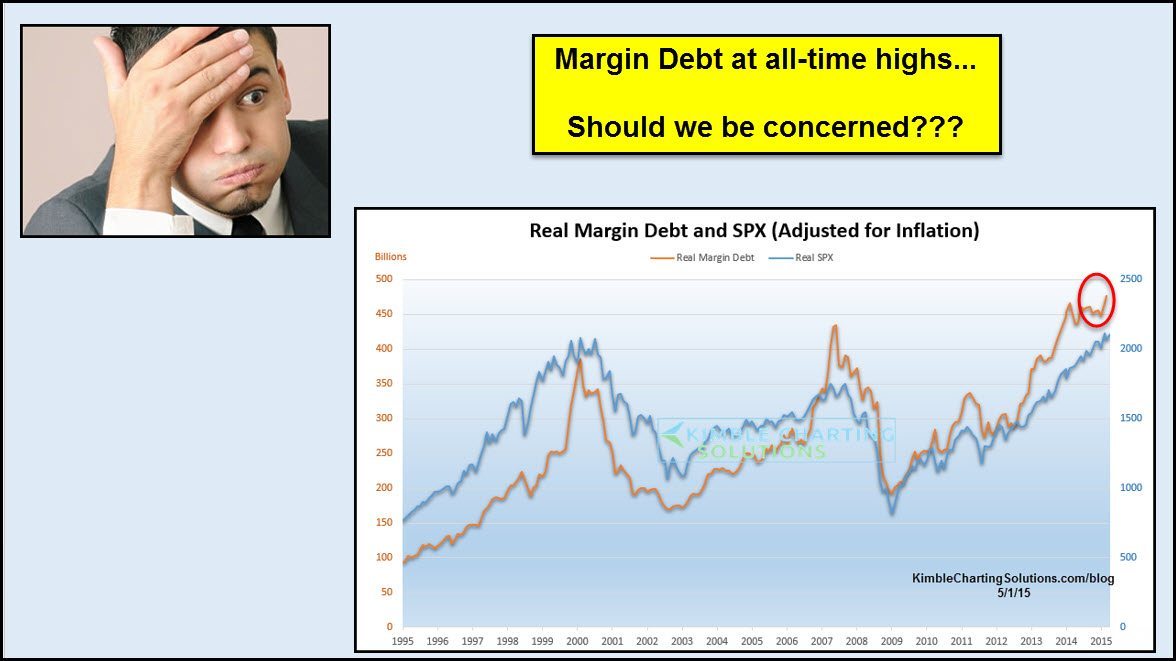
Margin Debt of late hit all-time highs, surpassing levels reached in 2000 and 2007, should we be concerned? In the long-term, margin debt at these levels will most likely become an issue that will impact markets, possibly like it has in the past.
In the past, it wasn’t high levels that ended up being the signal to reduce exposure to stocks. So what was the signal? When should we be concerned that these levels could impact stocks?
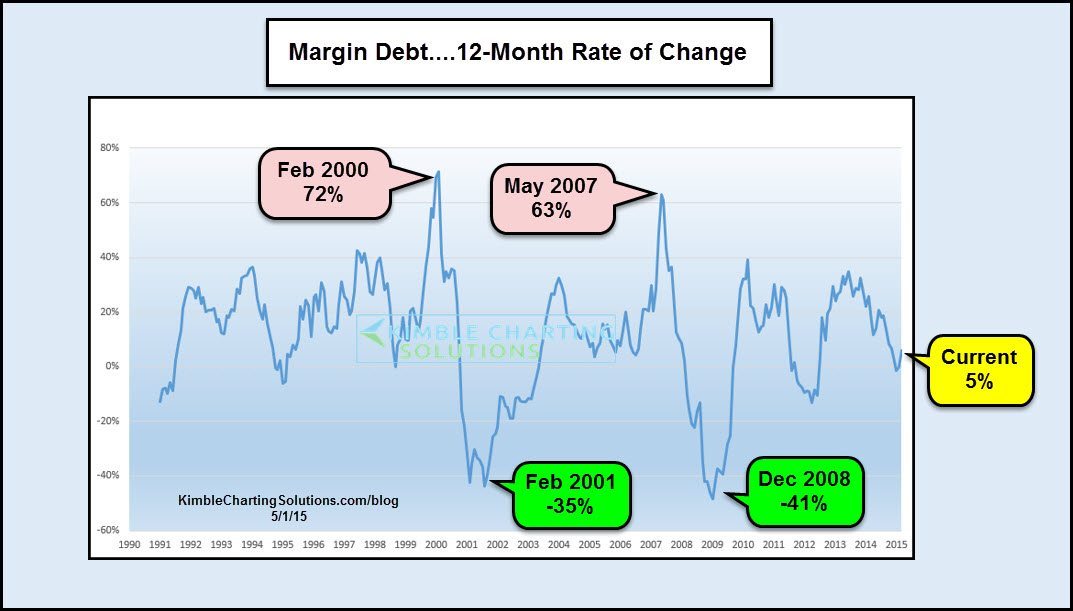
Below looks at Margin debt on a 12-rate of change. The chart below reflects that when margin debt was expanding rapidly on a 12-month basis in 2000 and 2007; then it turned sharply lower, that is when investors should have been concerned about stocks.
 CLICK ON CHART TO ENLARGE
At this time, the 12-rate of change is nowhere near levels in 2000 or 2007, when stock were peaking. As you can see the 12-month average is in the middle of the range established over the past 25-years.
If one is to use margin debt levels to determine exposure to the stock markets, one might get really concerned if the 12-month average was much higher and turning lower.
To receive Power of the Pattern Ideas on a Daily or Weekly Basis…
–

Thanks for this comment, I did mis label the charts, should have read “rate of change” I changed it. Thanks for the heads up, much appreciated. Chris
There is something wrong with the math or the definitions here. It makes no sense at all that the “12-month rolling average of margin debt” is NEGATIVE at certain times.
What might be somewhat interesting is to plot the ratio of “margin debt to total market value”. Or just plain “margin debt”. But even those measures contain less information than you might think. For example, in the last several years, companies themselves have borrowed much more than ~450B (which is the total margin debt at the end of the brownish graph) t o buy back their shares., And that is not accounted for at all.
PS: If I was going to speculate, perhaps the graph is of the following:
y= (aveTMD(t)/aveTMV(t)/(aveTMD(t-12months)/aveTMV(t-12months)) -1)*100
where aveTMD(t)=total margin debt at time t, averaged over last 12 months
aveTMV(t)=total margin value at time t, averaged over last 12 months.
That may be a somewhat interesting measure, but it does not at all measure the effect of companies borrowing money to buy back their stock. Why not? Because company debt is not included in Total Margin Debt. The latter only includes money borrowed from a brokerage by investors. It does not include debt incurred internally to the each company that is used to buy back shares.
re Margin debt . . . 12-month rolling average
5% of what? -14% of what? The chart is apparently an oscillator or rate of change. It should say so.
My friend wonders if ceteris paribus would change the interpretation. For example, how much has the cost of margin debt changed, or the qualification for different debt allowances, or the conditions/systems for margin calls. Who or what is the character of the population of marginalized debtors now verses then and how would that influence the interpretation of debt level risks over time.
It’s difficult to compare apples from different time periods when apples are hybridized, or gene modified, to evolve so rapidly.
I suspect that even measuring and reporting of margin debt levels has been modified to provide only marginal value to third party users/observers. My friend is cynical and enjoys your analysis.