

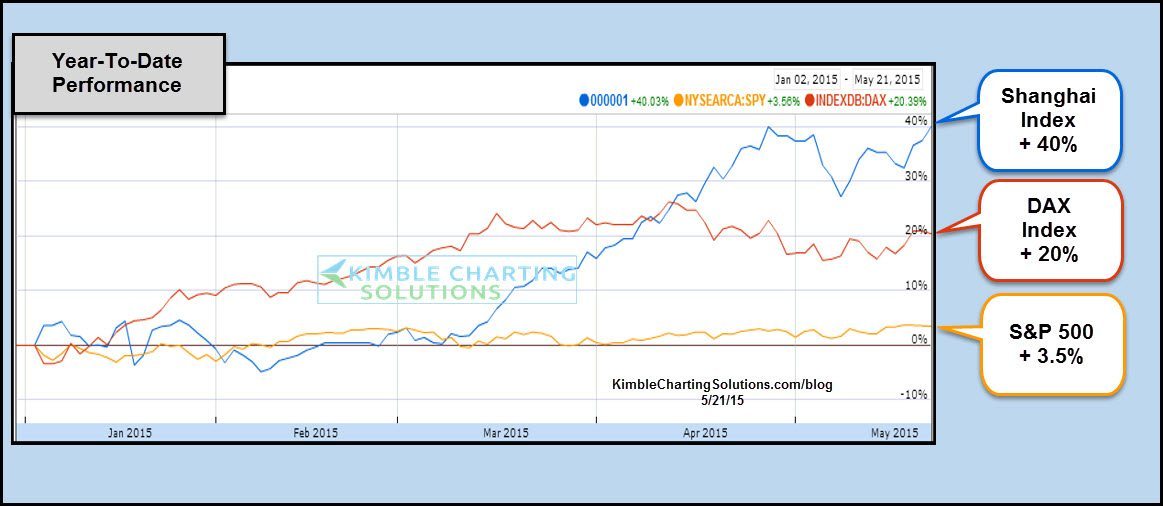
When it comes to Red Hot stock markets the Shanghai index fits the bill. Below looks at the Year-To-Date performance of the Shanghai, DAX and S&P 500 indices.
 CLICK ON CHART TO ENLARGE
As you can see the S&P 500 is lagging big time this year and even though the DAX is having a great year, the Shanghai is up twice as much.
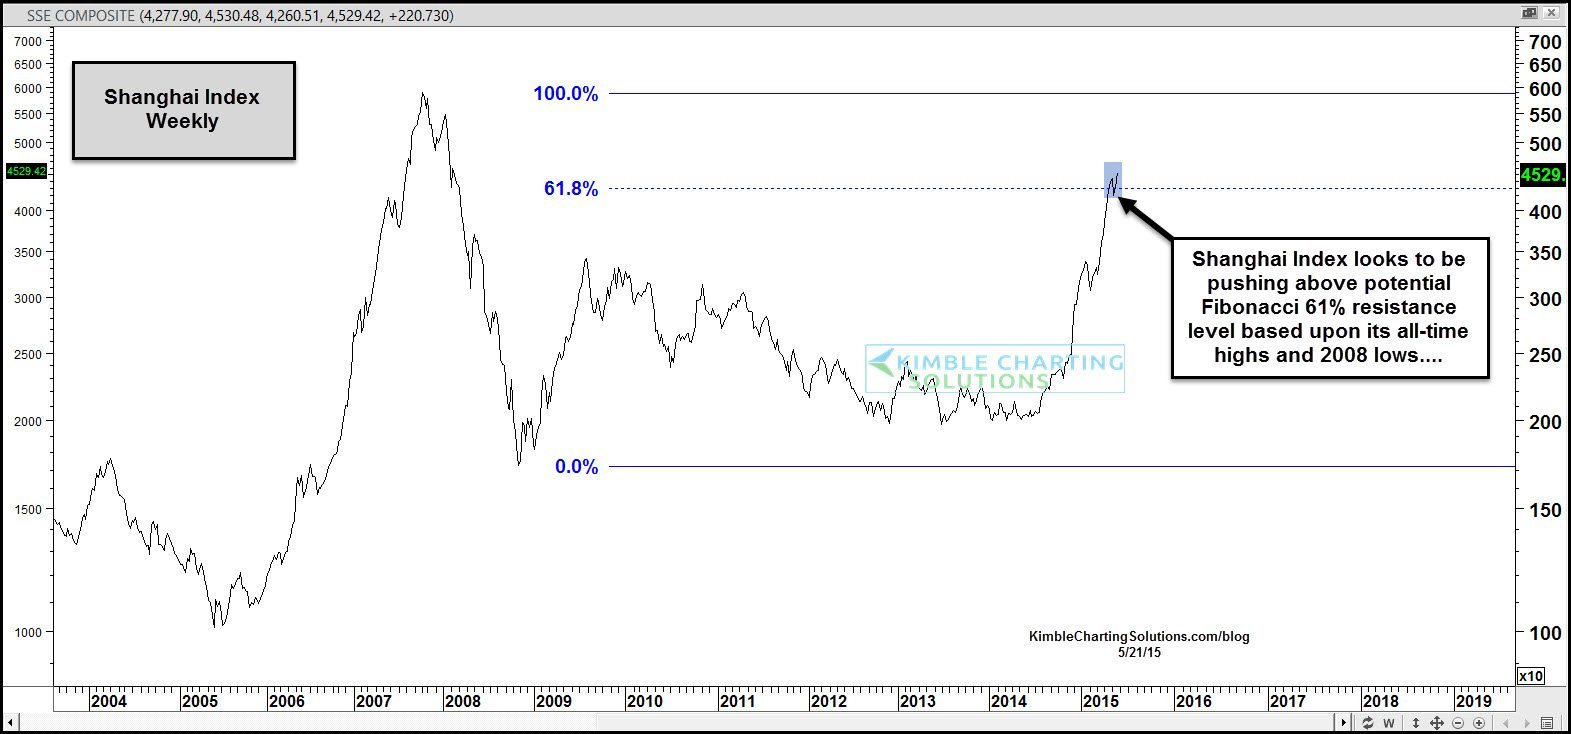
What would stop this Shanghai? Could it be a key Fibonacci level? The chart below looks at the Fibonacci 61% level, based upon its 2007 weekly highs and the financial crisis lows in 2008.
 CLICK ON CHART TO ENLARGE
The Shanghai index this week looks to be pushing above this potential resistance level, after testing this Fib level as support.
At this time the index is about 30% below its all-time highs. Will enough investors pile into this index so it makes a run at these highs?
The run in this index from 2005 to 2007 was incredible, as it went up 4 fold in just two years. Once support broke investors flocked to the exists. The current rising channel is near as steep this time. Steep rising support was critical then and I humbly feel it will be again.
Full Disclosure…Premium Members own the pair trade, Long Shanghai (FXI) and Short the S&P 500 since the end of March
–
