
 CLICK ON CHART TO ENLARGE
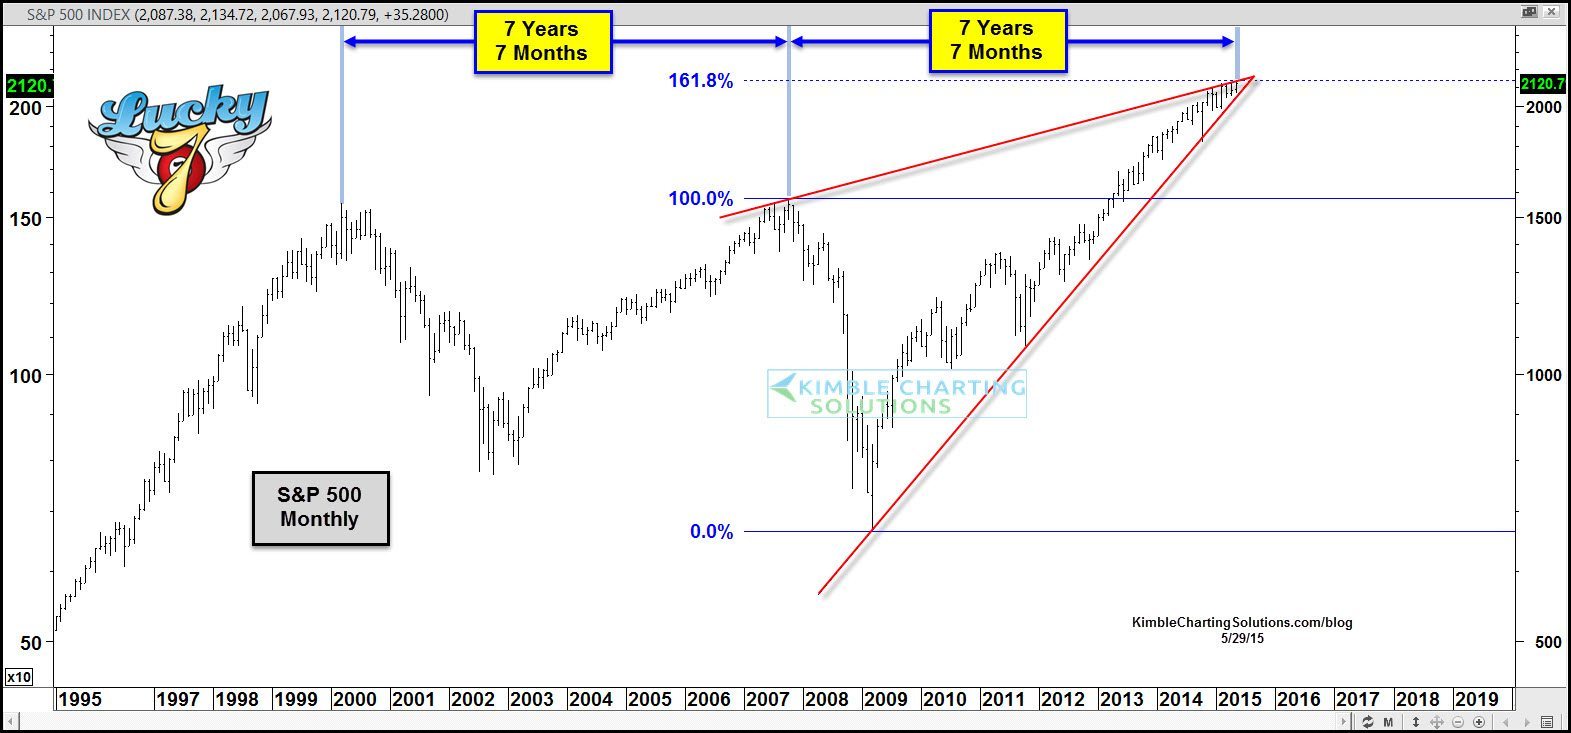
Could the S&P 500 be pulling a repeat of the 2000-2007 topping process?
The chart above reflects that the tops in 2000 & 2007 were 7 years and 7 months apart. Is it possible that another top is taking place 7 years and 7 months from the 2007 high? As the S&P is facing this potential time window repeating pattern, it is also staring the Fibonacci 161% Extension resistance level based upon the 2007 highs and 2009 lows, at the top of a rising wedge.
Is the S&P the only market facing a breakout test? The chart below takes a look at the white hot DAX index.
 CLICK ON CHART TO ENLARGE
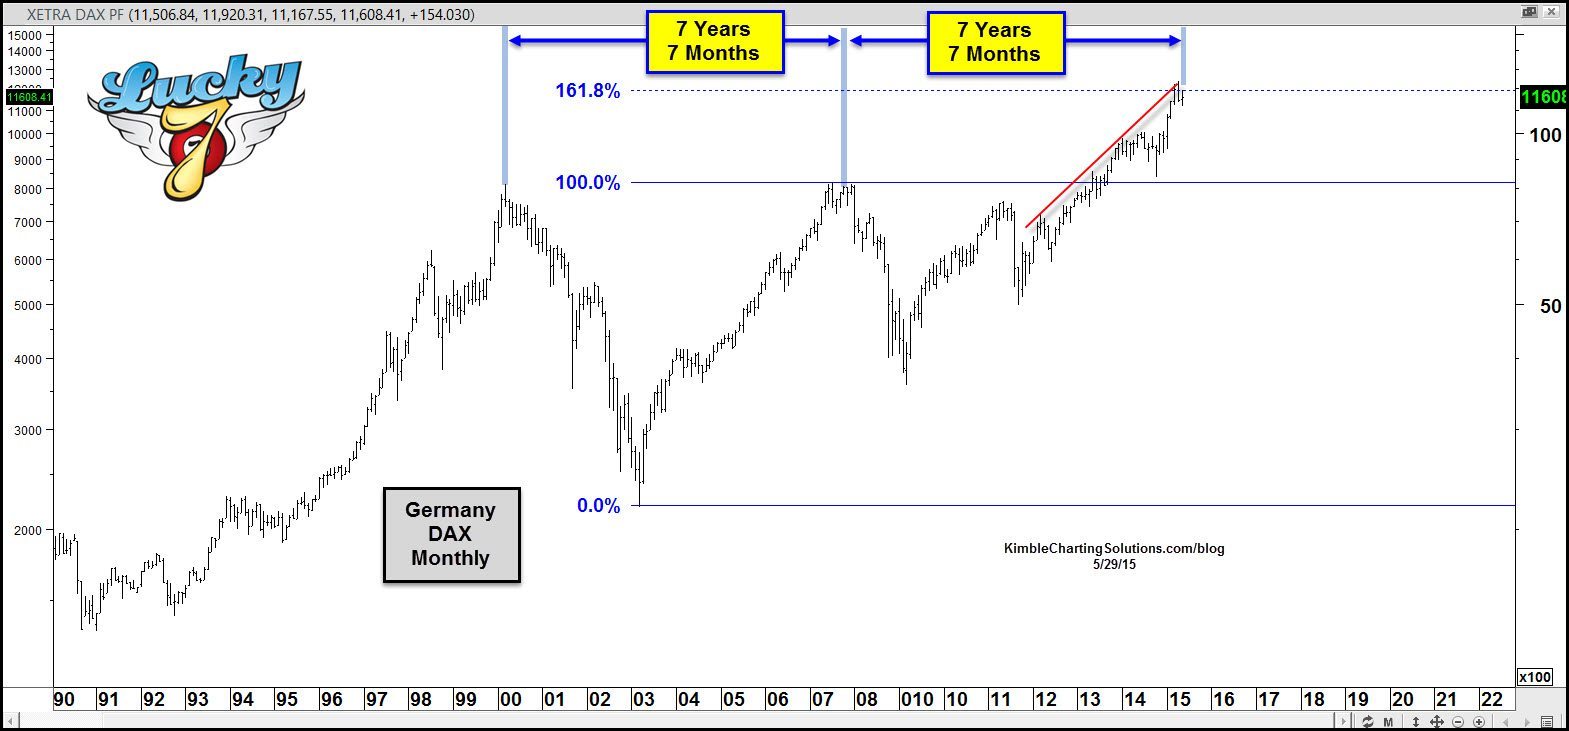
As you can see the DAX above is facing a time and price situation similar to the S&P 500 right now. The DAX is also facing its 161% Fibonacci Extension level based upon its 2003 lows and 2007 highs.
Are any other global markets facing resistance that could be important? Below takes a look at the Shanghai and CAC-40 Indices
 CLICK ON CHART TO ENLARGE
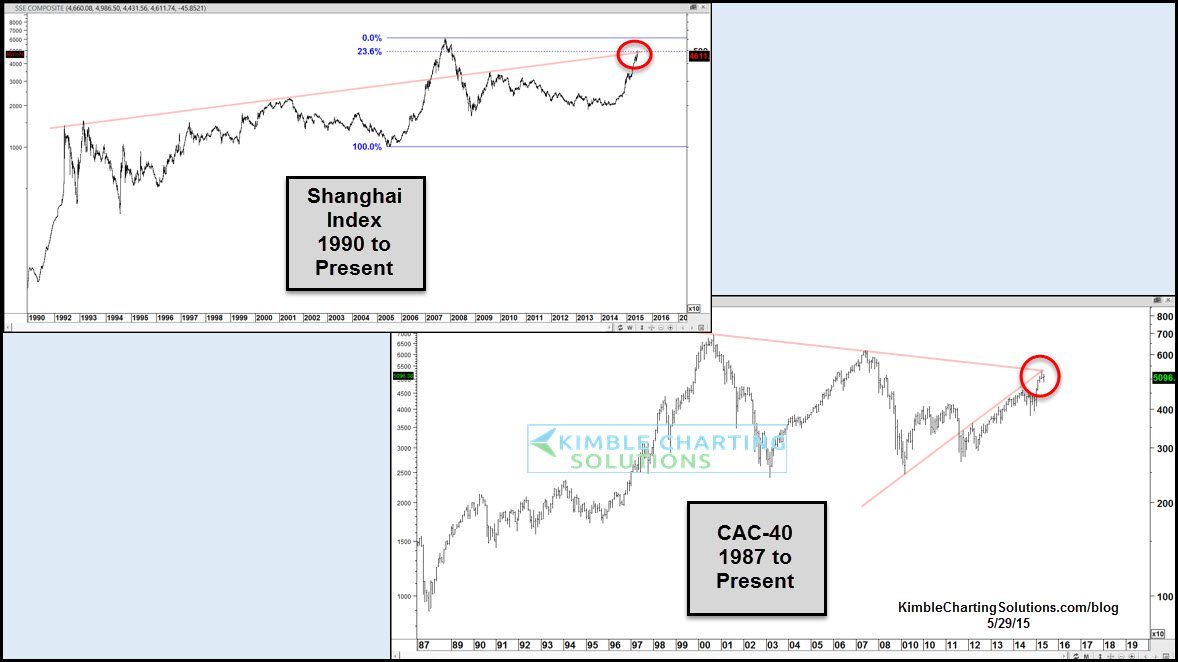
The Shanghai is staring its 23% Fibonacci retracement level based upon its 2005 lows and 2007 highs and a line dating back to 1992 that has reflected a few highs over the years.
The CAC 40 is up against a resistance line that is tied to its 2000 and 2007 highs as well.
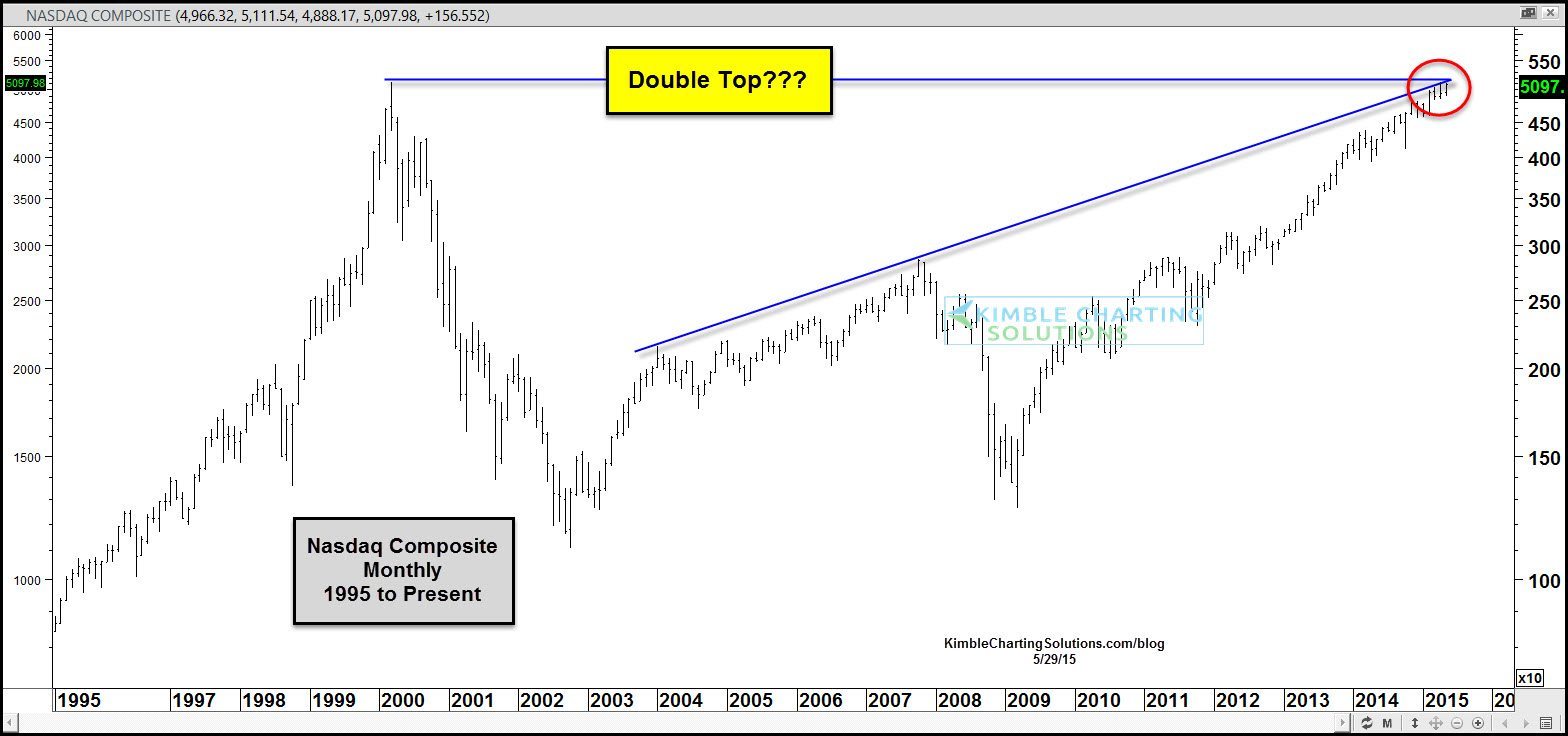
Double Top in the Nasdaq composite index 15-years later?
 CLICK ON CHART TO ENLARGE
Joe Friday just the facts…..This series of charts reflects that from a time and price perspective, several markets are facing would could be important breakout levels.
If you would like to stay up to date on these patterns, I would be honored if you were a Triple Play Advantage Member

–

chris, where do you get that top line? i see the fib extension and lower trendline, but the upper one isn’t hitting many data points. can you show the sp extension breakout target on the monthly pls