
 CLICK ON CHART TO ENLARGE
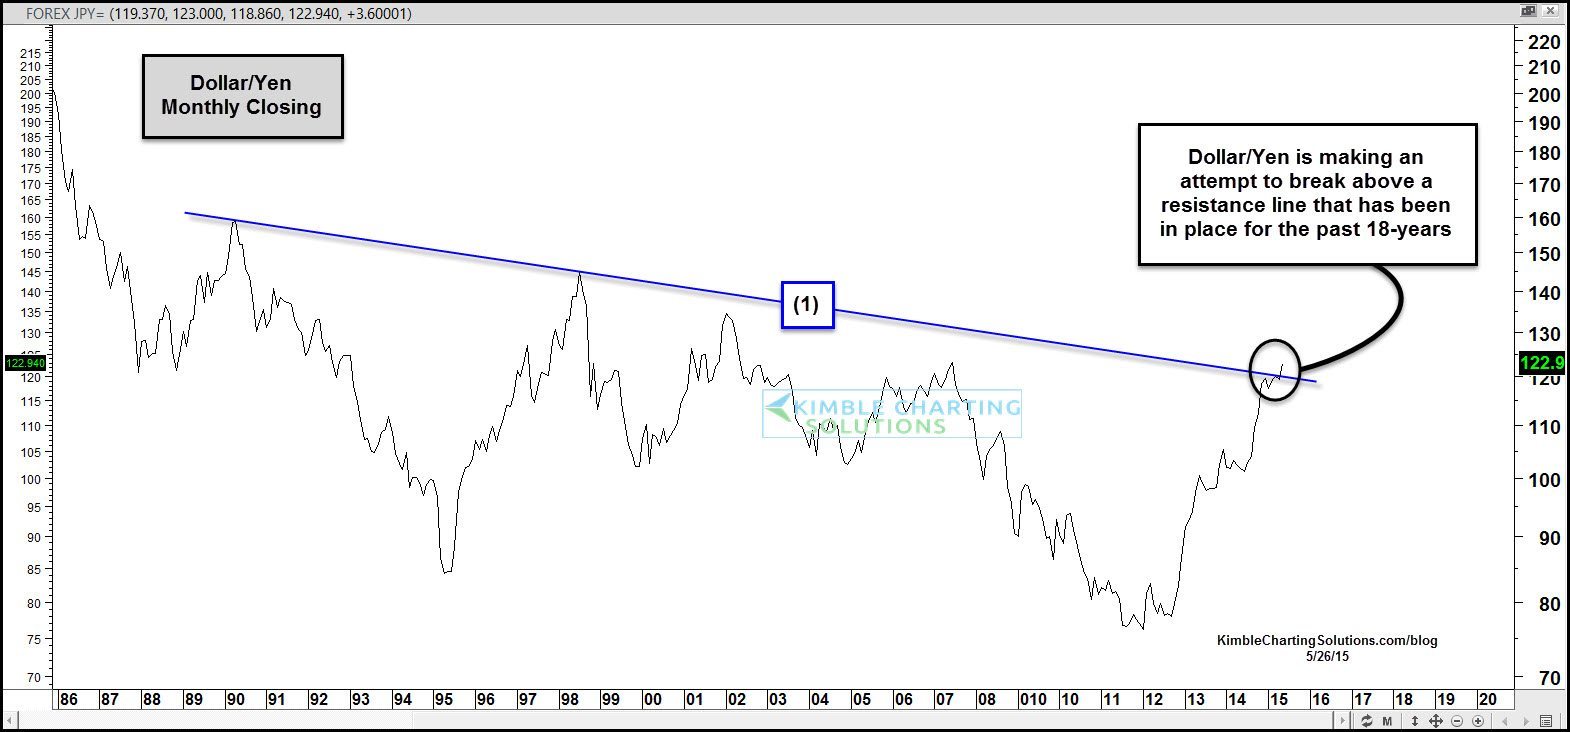
The chart above takes a look at the U.S. Dollar/Yen ratio over the past few decades. Monthly resistance line (1) has been in play for the past 18-years. As the month of May is nearly over with, the US$/Yen is making an attempt to break above this long-term resistance line.
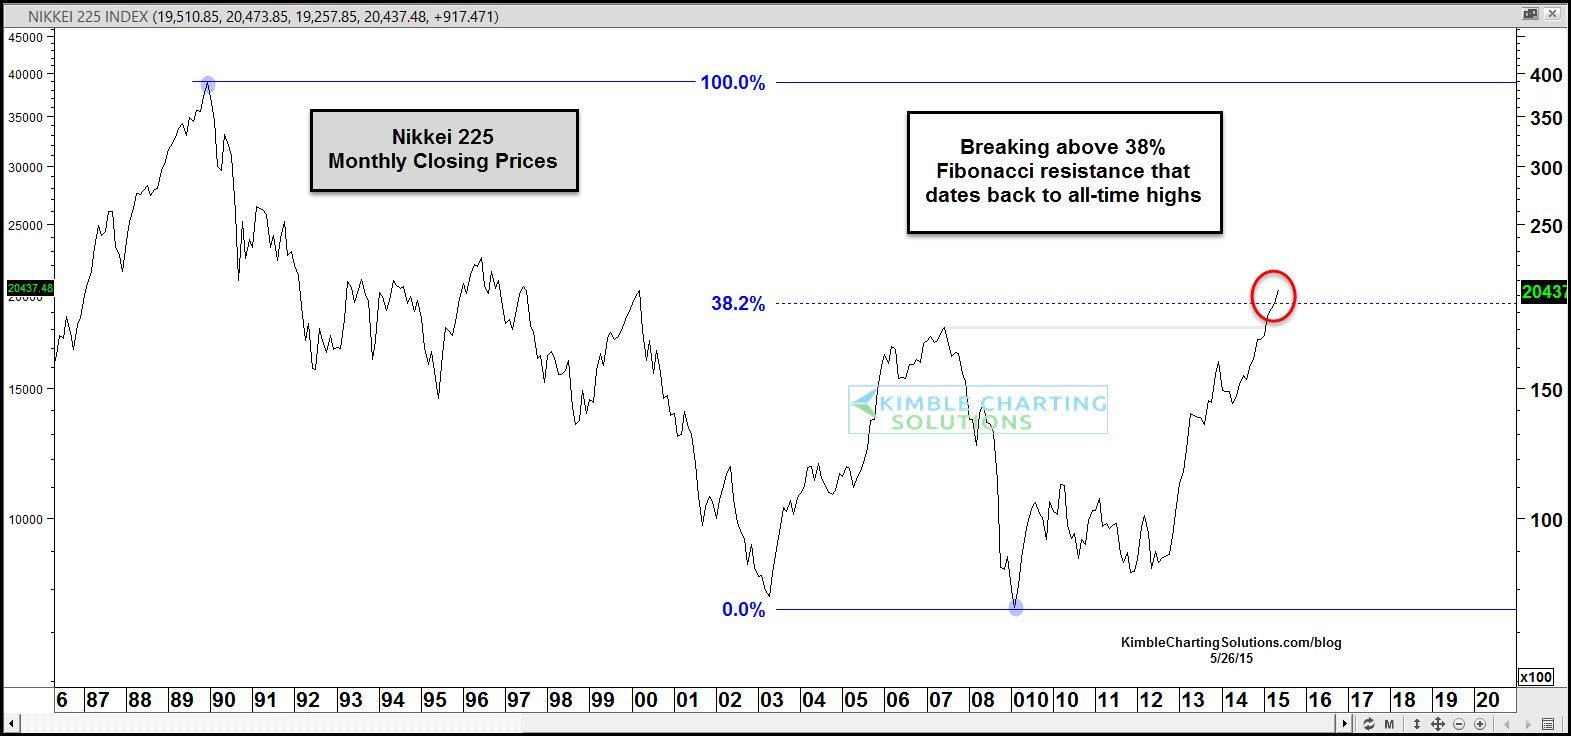
It is frequently expressed that Yen weakness, can be a positive for the Nikkei 225 index. Below looks at the Nikkei Monthly, over the past 30-years.
 CLICK ON CHART TO ENLARGE
This chart reflects that the Nikkei is working on a break above its 38% Fibonacci resistance level, that is tied to its highs in 1989 and the lows during the financial crisis back in 2009.
The Nikkei over the past 6-months is one of the better performing stock markets in the world.
A breakout in the US$/Yen and the Nikkei increase the odds that the current trends in play, continue.
–
