

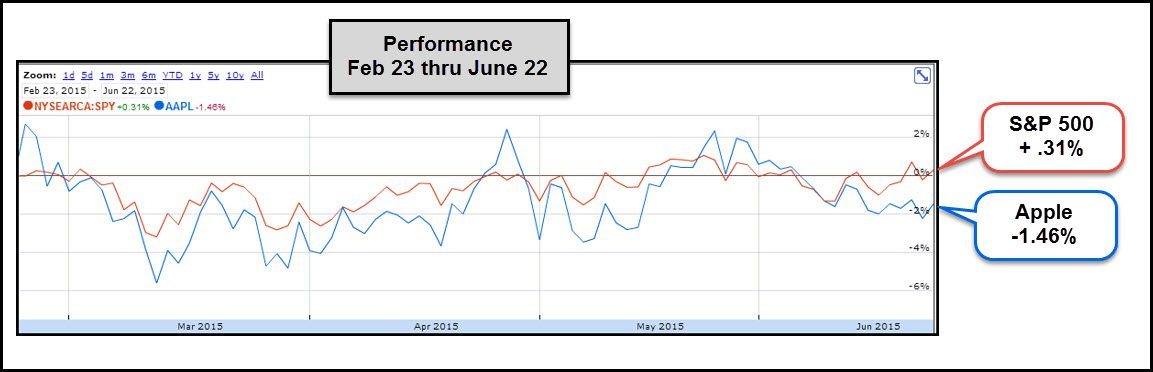
The worlds largest company has been rather quiet the past 4-months! The table below highlights that Apple has mostly traded sideways of late and its down a little over 1% since February 23rd.
 CLICK ON CHART TO ENLARGE
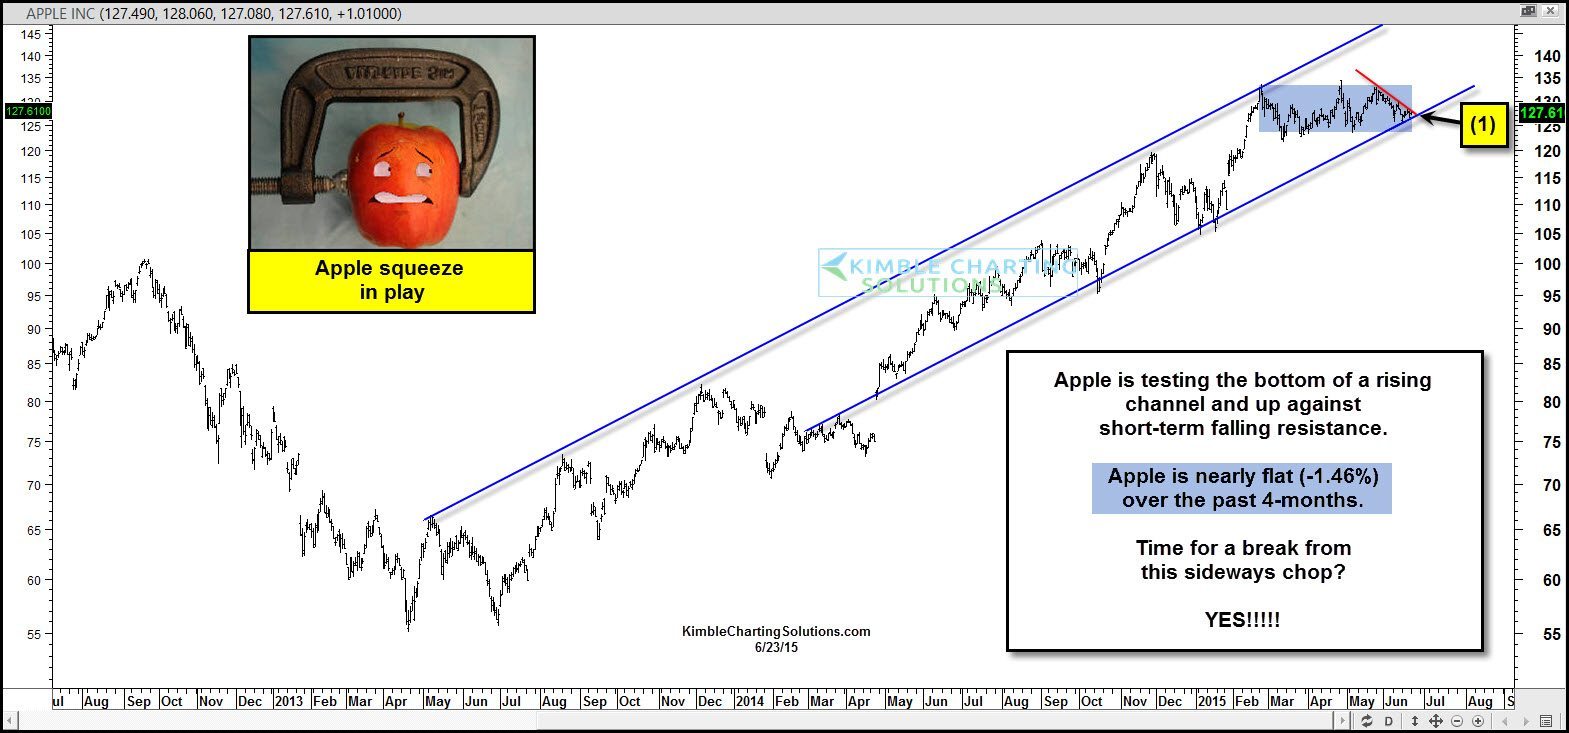
Is this sideways action about to end? It looks like it from a Power of the Pattern perspective!
 CLICK ON CHART TO ENLARGE
The sideways action of the past four months in Apple is reflected by the blue shading in the chart above. Four months ago Apple hit the top of this rising channel. The sideways action of the past 4-months now has Apple at the bottom of this rising channel and now facing short-term falling resistance at (1) above.
Either a bounce off support and a breakout above short-term resistance is about to happen or a break of rising channel support that has been in play for the past year will take place.
With Apple being the largest company in the S&P 500 (4% of the index) what Apple does at (1) above could have a big influence on what the S&P 500 does next.
–
