
 CLICK ON CHART TO ENLARGE
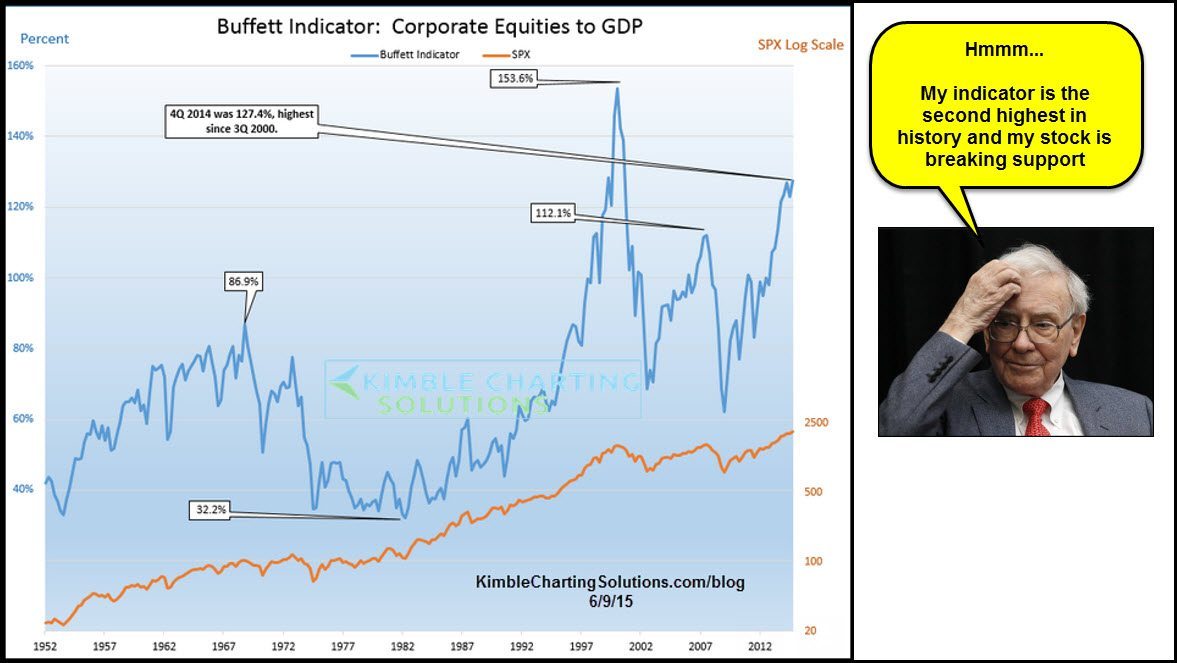
The Buffett indicator, which compares Corporate equities to GDP is now hitting the second highest level in the past 50-years. This indicator is around 15% above 2007 levels and around 16% below levels reached in 2000.
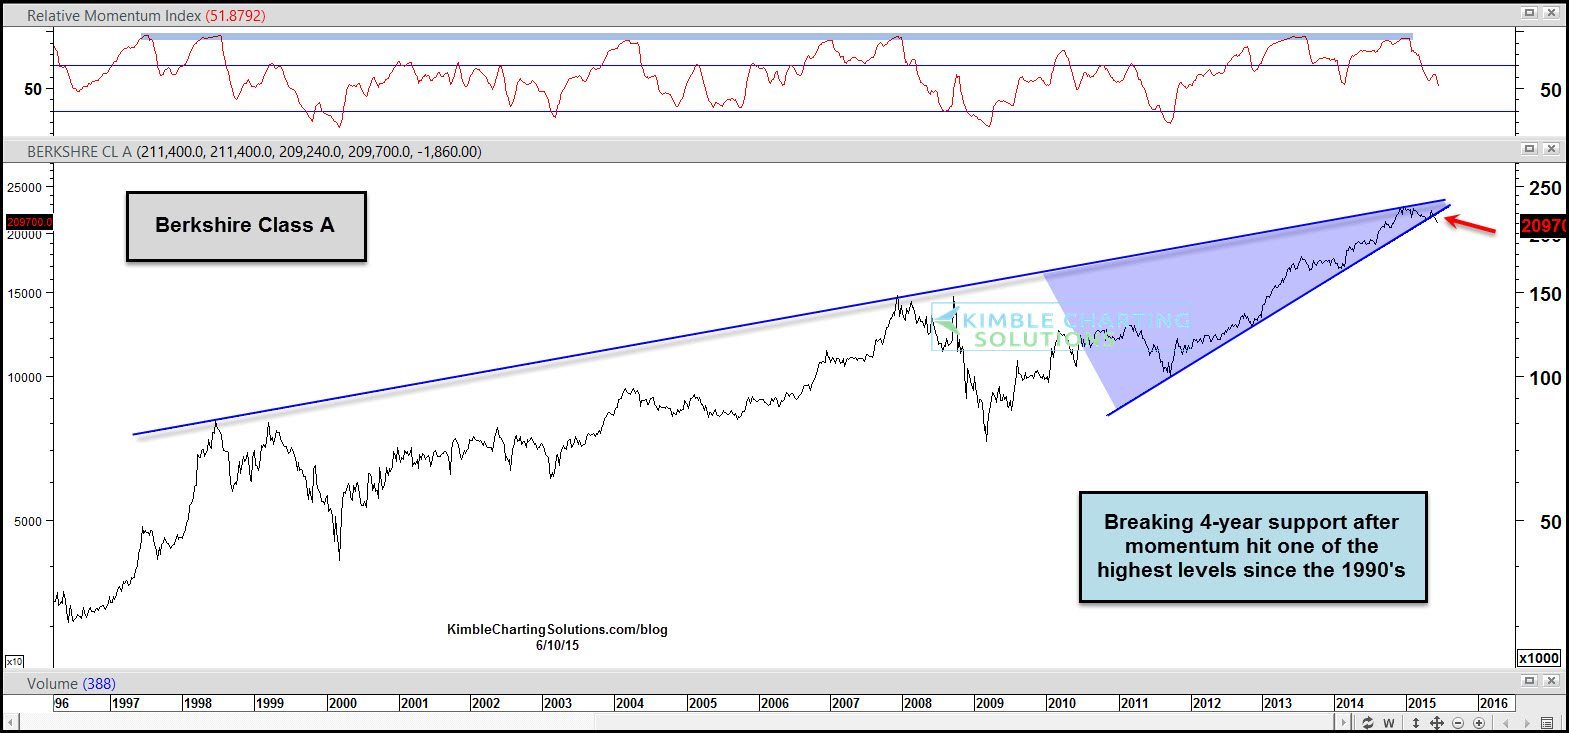
Speaking of Buffett, have you looked at Berkshire stock of late? Below looks at Berkshire Class A stock since the late 1990’s.
 CLICK ON CHART TO ENLARGE
Berkshire of late hit a resistance line that dates back to the 1998, which appears to have stopped its upward progress. As it was hitting this resistance line, weekly momentum was hitting levels rarely reached in the past 25-years. In the short-term BRK.A is edging below support that has been in play since 2011.
So what does it mean that the Buffett indicator is so high? From a big picture perspective, no long lasting bull market has ever started from these levels. On the flip side it does not mean that the current bull market has to end, as the trend is up at this time.
Berkshire could be weak of late due to exposure to the Transportation sector, as UNP has been rather soft recently.
From a big picture perspective, this combo of high valuations and a break of support is worth being aware of!
–
