
 CLICK ON CHART TO ENLARGE
Almost 90-days ago the US Dollar was dealing with a 14-year resistance line that dated back to its all-time highs in 1985, around the 95 level. It pushed above this resistance line and closed just above the 100 level on the week ending 3/13/15. Since then the US$ has backed off some, coming back to test the old resistance line as potential test of support for its first time in history, around the 93 level.
Since testing this support line for the first time in history, the US$ has rallied around 4%.
At this time the US$ finds itself above the 93 support level and below this highs it hit at the 100 level.
 CLICK ON CHART TO ENLARGE
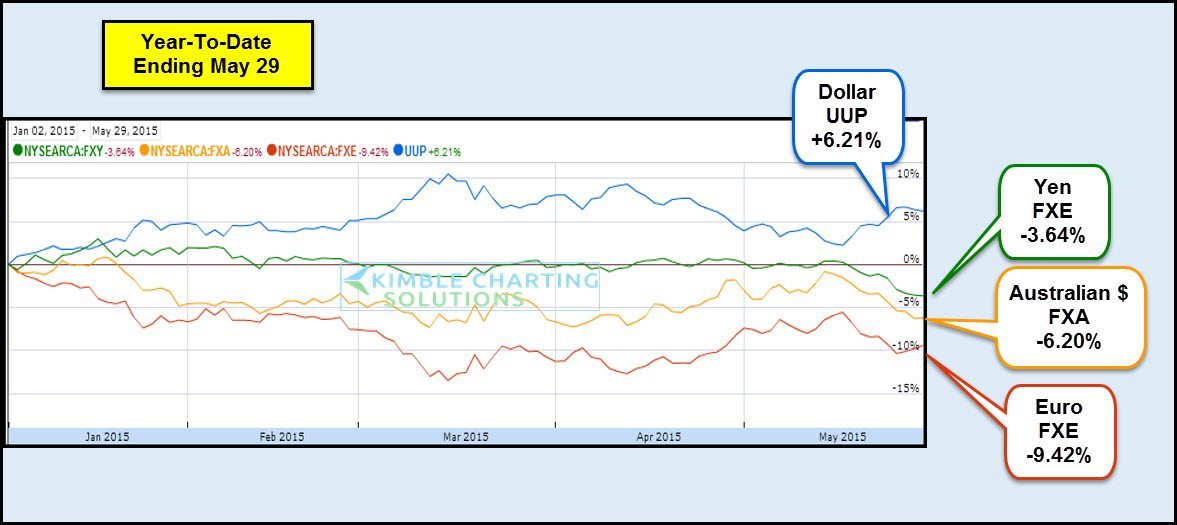
This table looks at key currency ETF’s performance through the end of May.
What King Dollar does in the near future at these key support/resistance levels, could have a large impact on portfolio construction going forward.
Commodities have not liked the rally of the US$, off the 93 support level (they’ve been pretty soft). A break below the 93 support line should be good for commodities and a break above the 100 level, could be painful for commodities.
Which way the dollar breaks out or breaks down from this 7% trading range, could be very important for which assets to own between now and the end of the year!
–
