

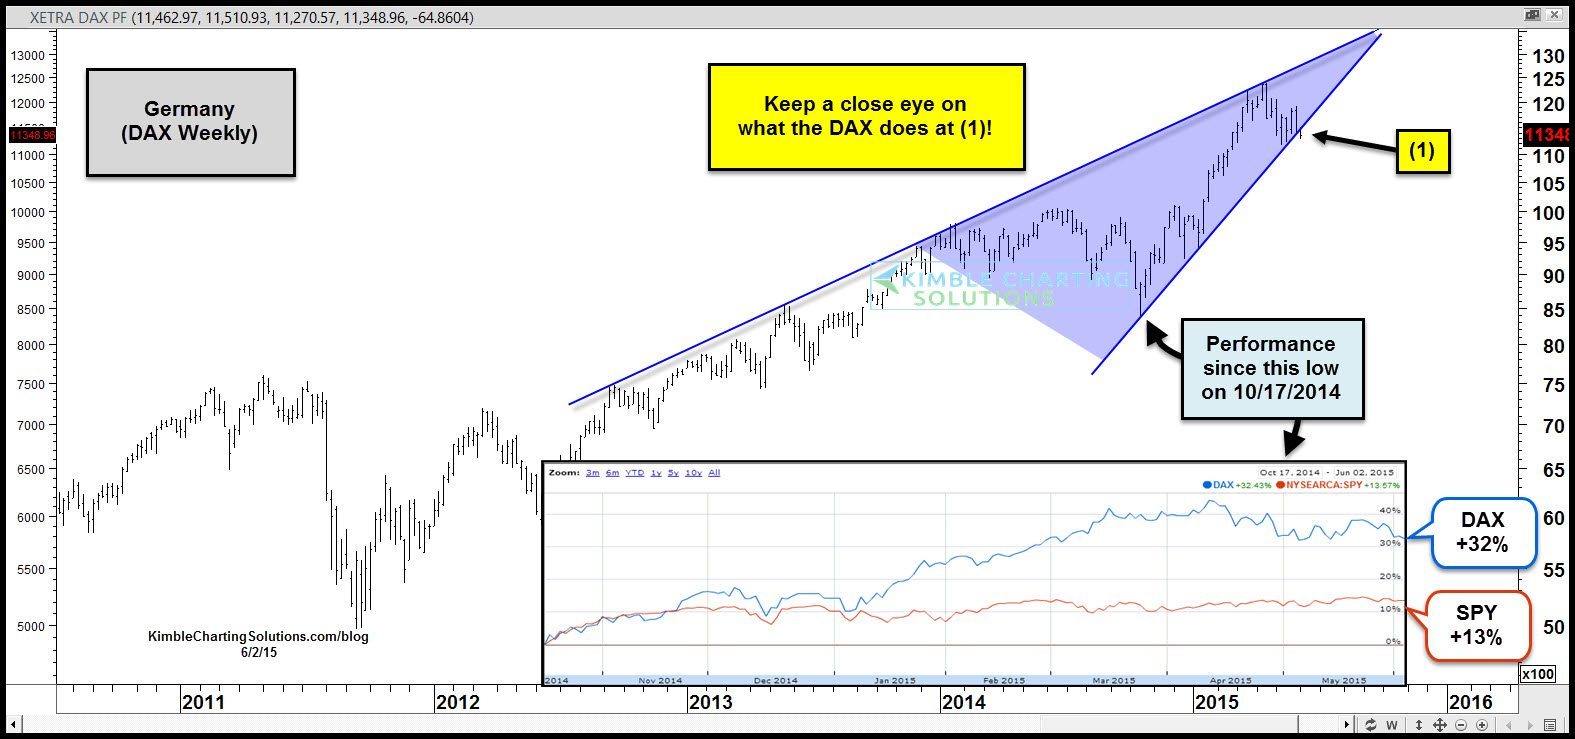
When it comes to global stock market leadership, the DAX comes to mind. Since the DAX hit a low during the Ebola scare last October, it is up 32% since 10/17/2014 (see lower inset chart)
 CLICK ON CHART TO ENLARGE
The DAX has been soft the past 7 weeks after it hit resistance at the top of this rising wedge. The softness over the past few weeks has the DAX testing the bottom support line of the rising wedge pattern. Two thirds of the time when support breaks of a rising wedge, prices end up lower. The DAX could be making an attempt to break rising support at (1).
Should support break, it could be taking place at a very important point in “time!”
 CLICK ON CHART TO ENLARGE
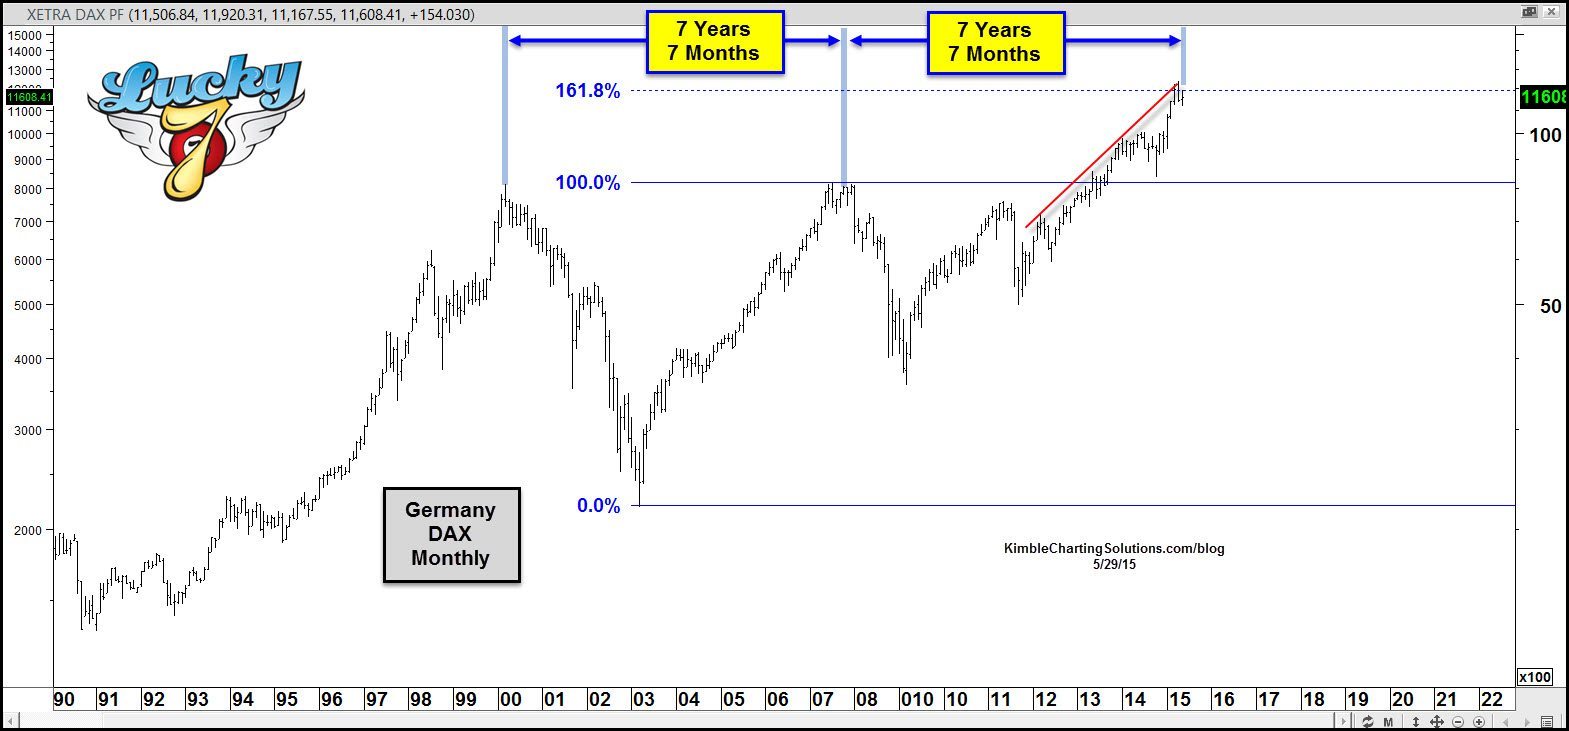
This chart reflects that the highs in the DAX from 2000 to 2007 were 7-years & 7-Months apart. If one takes the highs in 2007 and adds 7 years and 7 months, the DAX was hitting the Fibonacci 161% resistance level. The S&P 500 also could be making a key high, 7 years and 7 months apart. (See post here)
The DAX could be breaking support of the rising wedge pattern. Since the week is FAR from over with, where the DAX finds itself a couple of weeks from now could send a very powerful message per this index and the S&P 500!
–
