

CLICK ON CHART TO ENLARGE
Google rallied strongly from 2005 until 2007, gaining over 100% in this short time frame. In 2007, it created a reversal pattern (bearish wick) at (1), which ended up being an important high. After that reversal pattern, Google and the S&P 500 were both cut in half.
Of late Googles strong move higher last week, following their earnings report, pushed it to a long-term resistance line and a Fibonacci 161% extension level at (2). As it was hitting the dual resistance, it created a reversal pattern (bearish wick), similar to what it did back in 2007.
Any other key assets acting they did in 2007?
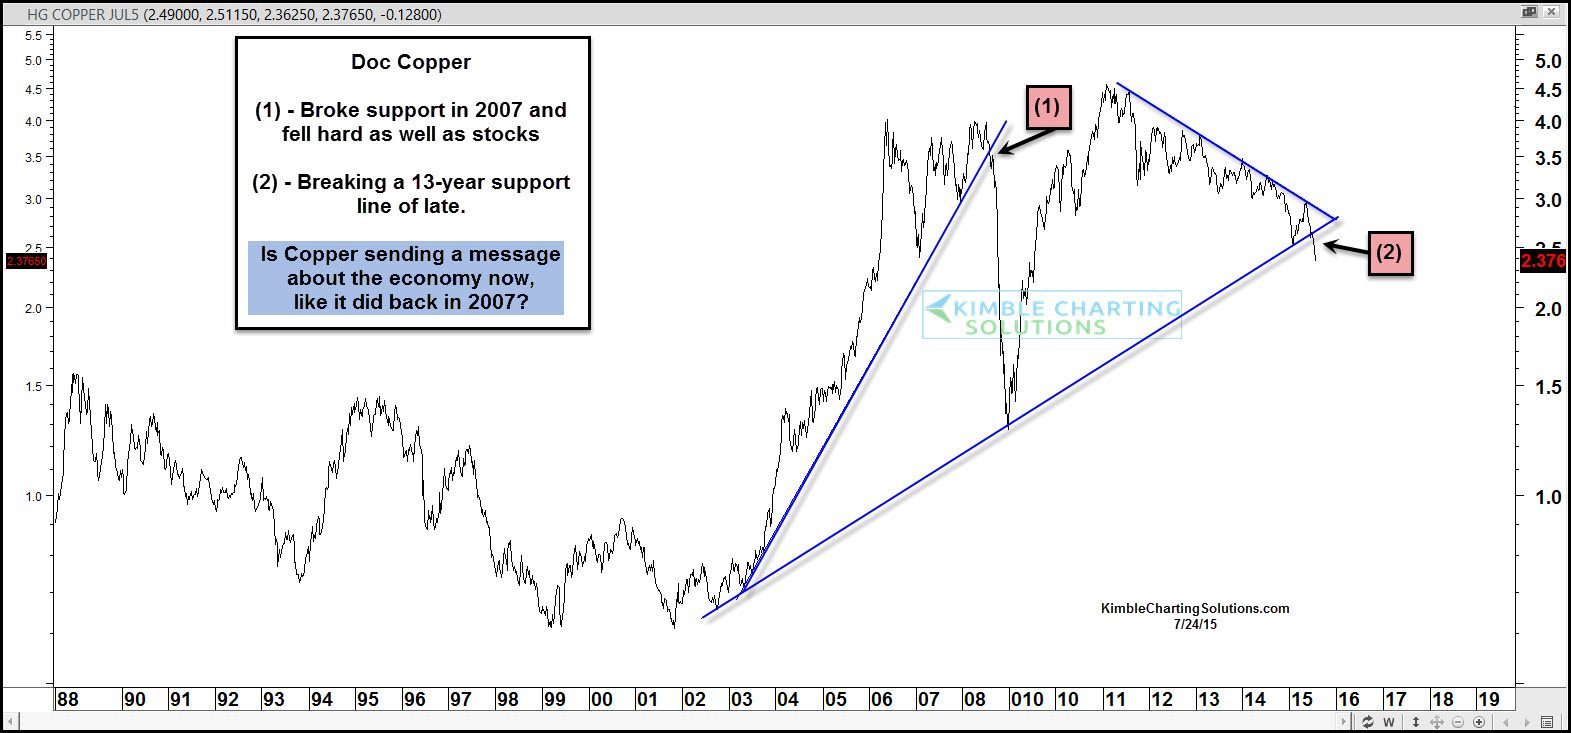
Doc Copper is often viewed as a leading indicator for the global economy. Below is a long-term update on the price action of Copper
 CLICK ON CHART TO ENLARGE
Copper broke a 4-year support line in 2007 at (1) and fell almost 75% during the financial crisis. Of late Copper has fallen over 20% in the past couple of months and is breaking a 13-year support line at (2). Is Doc Copper sending a key message about the state of the global economy?
Google and Copper broke key support in 2007 and both fell hard, as did the S&P 500 and markets around the world.
Joe Friday, just the facts.…If Google and Copper would happen to head sharply south together, they could be sending a message that investors might want to pay close attention too!
–
