
 CLICK ON CHART TO ENLARGE
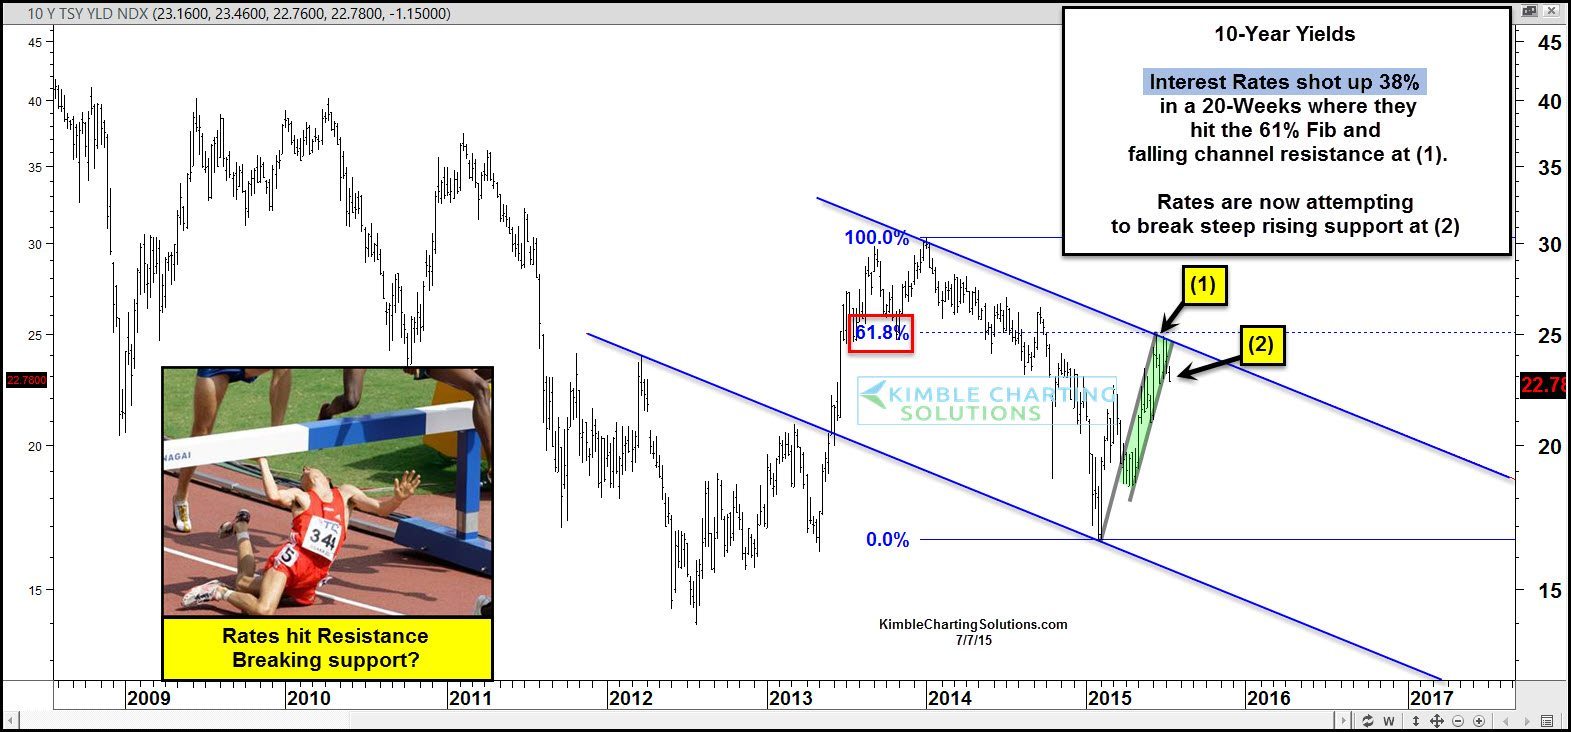
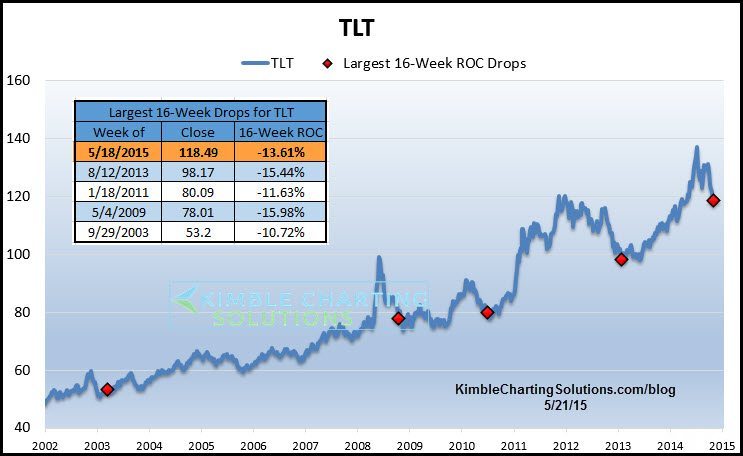
From the first of February to the end of June, the yield on the 10-year note shot up nearly 40%. This sharp rally hurt bond funds big time, as TLT suffered one of worst short-term declines in its history, falling 13% in a 16-weeks. (See post here and chart below)
The strong rally in yields took them to the 2.5% level, where they hit dual resistance at (1) above. This dual resistance was its 2-year falling channel and the 61% level. Now yields could be breaking down from its historic yield rally.
 CLICK ON CHART TO ENLARGE
The chart above reflects times when TLT suffered large 16-weeks declines and where they took place over the past 13-years. As you can see, more often than not, TLT was much closer to a low than a high!
Few thought rates would rise at the first of the year (70% of investors were bullish bonds) and boy were they wrong.
Of late, polls are suggesting the vast majority has flipped, per thinking rates will rise. Will the majority be wrong again (29% bond bulls at this time)???
If rates break down at (2) above it would fool a good deal of people again and would suggest that bond players feel something is going to slow down or soften in the commodity or stock markets.
Full Disclosure…Premium and Sector/Commodity Extreme Members are long bonds at this time.
–
