
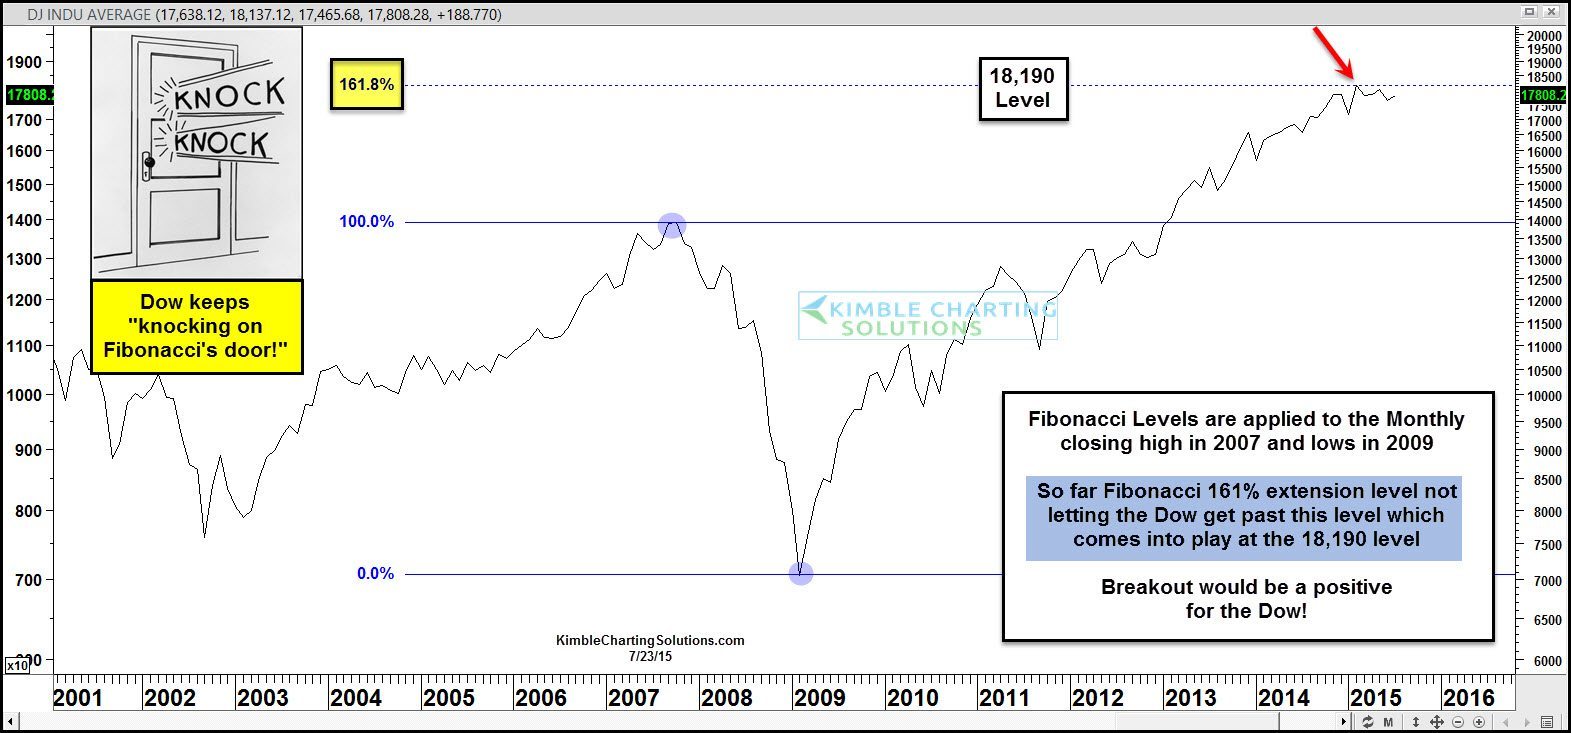
For the Dow, two of the most impactful prices over the past 15-years happens to be the 2007 highs and 2009 lows. Could those two dates have an impact on the Dow in 2015? The Power of the Pattern would say yes!
If one applies Fibonacci levels to these key dates a Fib 161% extension level is created at the 18,190 level. This becomes a breakout/resistance zone for the Dow.
The Dow closed at 18,132 in February, 58 points shy, a 3rd of a percent away from the 161% level and has since backed off a little bit. For the majority of the year the Dow has been knocking on the door attempting to breakout above this price zone.
I believe we are all aware that the Dow just represents 30 stocks and its not great tool to measure the broad markets. Keep this in mind, if one applies Fibonacci to the same price points in the S& 500 has been knocking on the same 161% extension level, which has held it in check as well.
Will the Dow and S&P be able to knock the 161% door down and push higher? A breakout for both would be viewed as a positive event, so stay tuned to see it they can push past these key levels.
–

I m a fan Kimblechart solutions and always eppreciate your analysis. ^^
With respect to your chart, I hv tried to follow your point of view with Fibonacci extension but why i saw DJ at ard 18,100 point is at Fib 150%, not 161.8%.
Best regards,
AJ
did you mean 18190 in the blue box???
Yesterday your post pointed to three or four charts indicating a breakdown. today you point to a breakout. I’m not sure how I can use these charts of yours except as an intellectual exercise.