
CLICK ON CHART TO ENLARGE
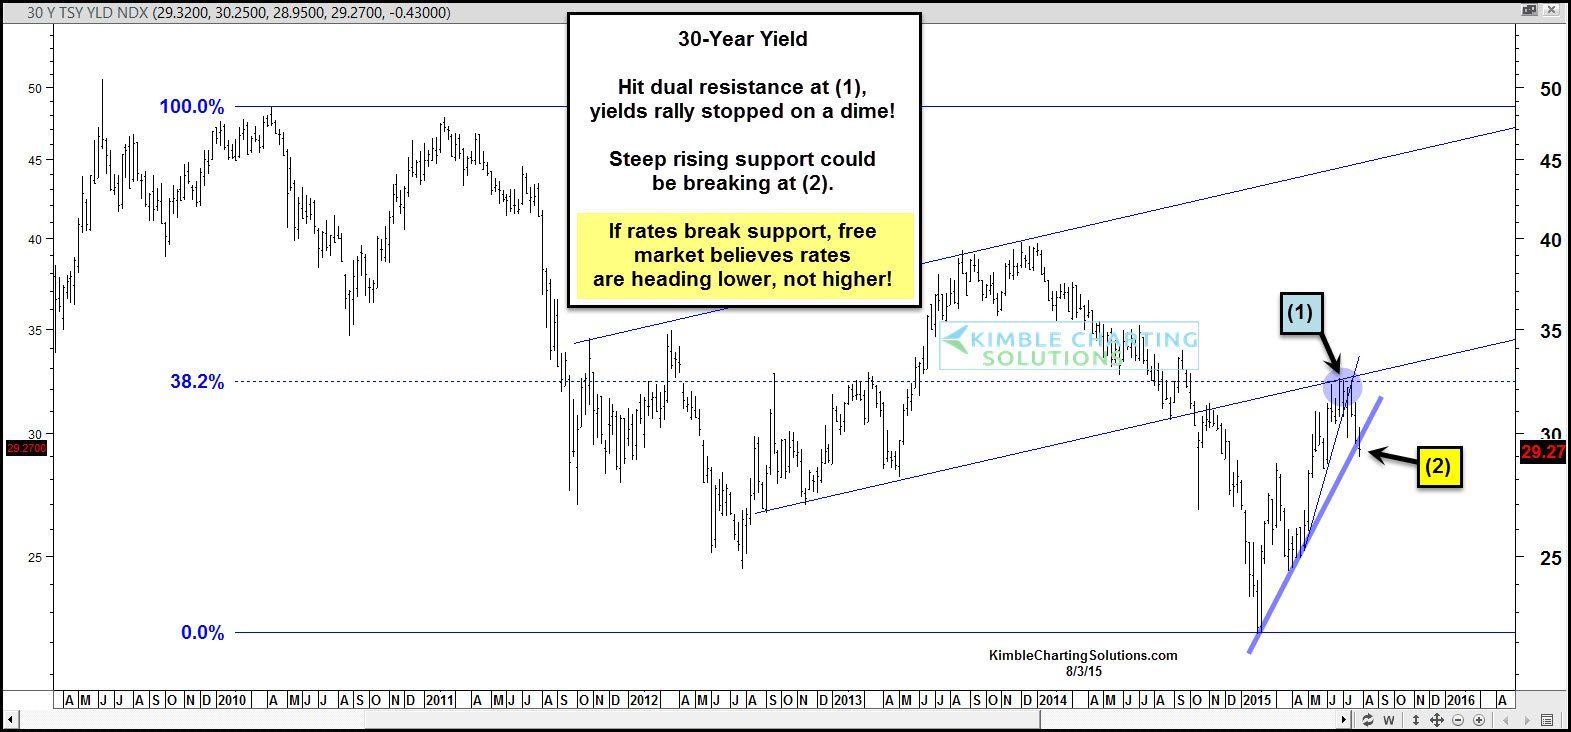
This chart looks at the yield on the 30-year bond. Yields rallied strongly from the first of February to the first of July (up 30%). This strong rally in yields hit dual resistance at (1) above, which was the 38% retracement level and the bottom of a rising channel, which both came into play as resistance. Once yields hit resistance a month ago, yields have been falling and bond prices moving higher.
Now yields are attempting to break steep rising support at (2) above.
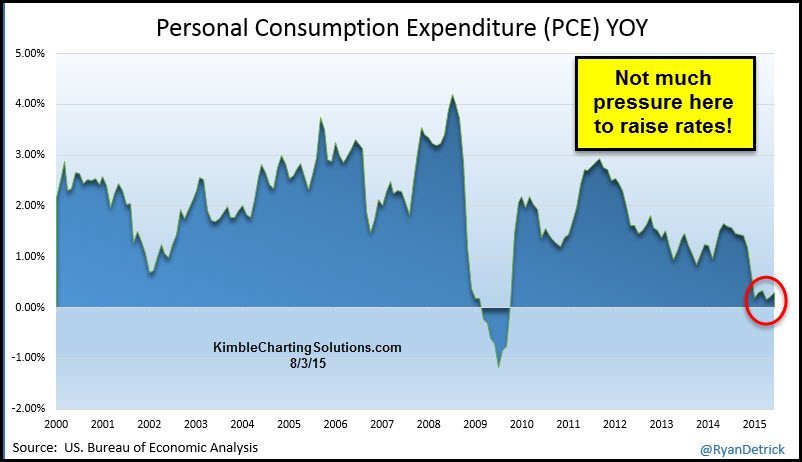
Below is a very cool chart of the Personal Consumption Expenditure index on a year over year basis, shared by Ryan Detrick
 CLICK ON CHART TO ENLARGE
As you can see the index remains very low at this time. The only time it was lower, was during the financial crisis in 2009. Think about this, despite the S&P 500 near all time highs, this reading is close to the lowest levels in the past 15 years!
On the surface, the PCE index is not reflecting much pressure for the fed to raise rates at this time.
Crude Oil could be breaking support and the TR commodity index could be breaking dual 15-year support right now and potentially part of a 20-year commodity bear market. (see chart here).
With Crude and Commodities soft of late and potentially breaking key support and the PCE index not showing much signs of inflationary pressures, if yields take out steep support, they could fall further, which could push bond prices higher and TLT past resistance (see chart here)
