

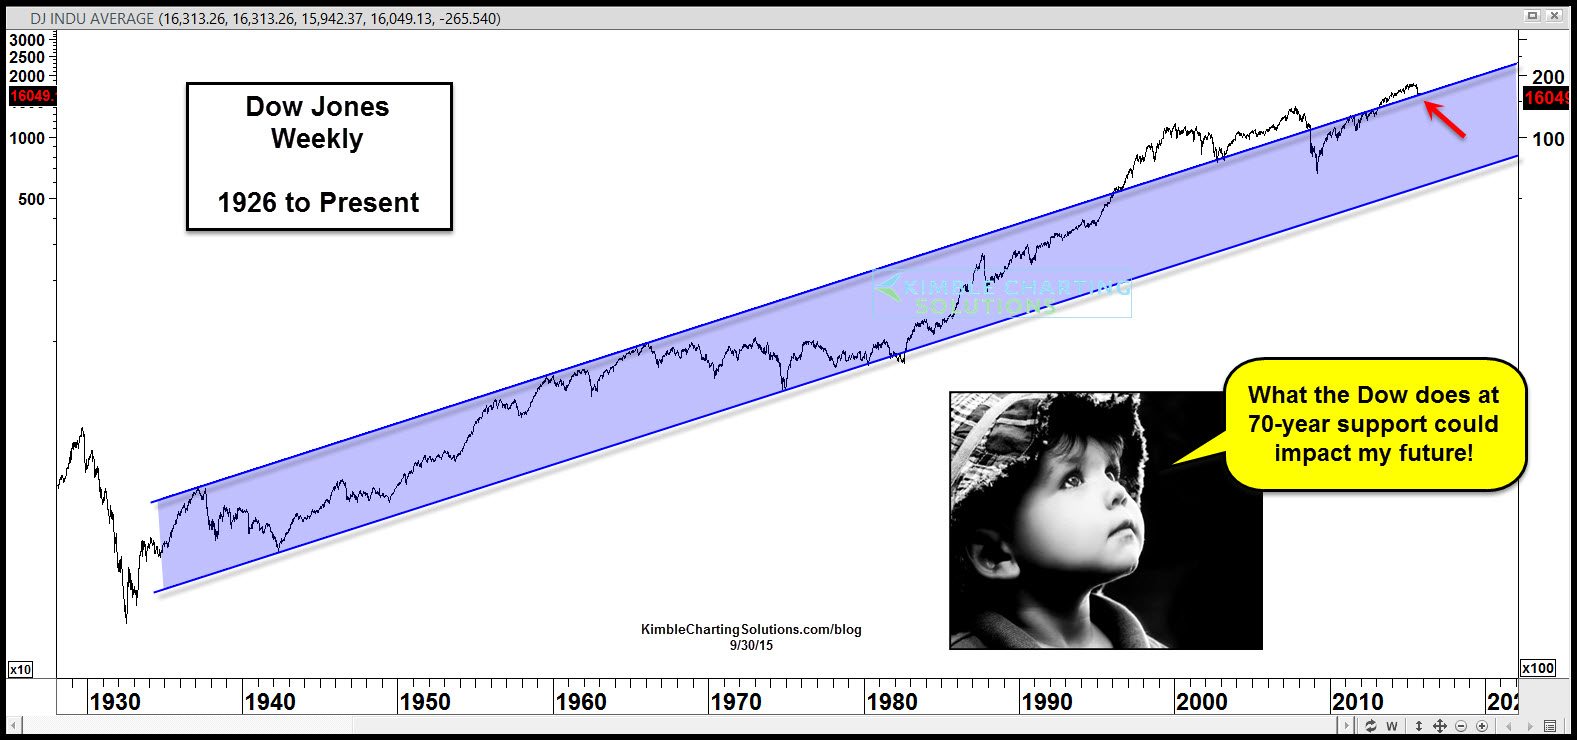
Unless you live in a cave, your most likely well aware the stock markets around the world have been soft the past few months. The chart below looks at the Dow from a 50,000 foot view, going back to the 1920’s.
CLICK ON CHART TO ENLARGE
As you can see the Dow has spent a good number of years inside of this rising channel. It broke above the channel in the late 1990’s and become support at the 2002-2003 lows.
In the 2007-2008 time frame, once support broke, the Dow fell hard for a few months.
Now the Dow is testing 70-year channel support this morning.
Carl Icahn has expressed concerns that the stock market could fall a large percentage. See Carl’s concerns HERE
Support is support until broken and the Dow right now it hitting one heck of a support line.
Should this support fail to hold, the little boys comments above, say it all!
–
