

Welcome to the fourth quarter of 2015! Good friend Ryan Detrick put together this nice piece for us and I wanted to share this on the first day of the new quarter.
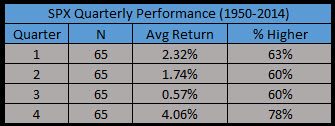
It hasn’t been a good year for the bulls, but is that about to change? The good news is this is historically the best quarter of the year.
CLICK ON CHART TO ENLARGE
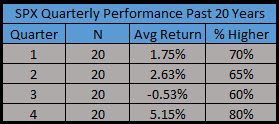
The past 20 years it has been even better. Also, notice the third quarter has a negative average return. In other words, is the weakness this quarter really a surprise?
CLICK ON CHART TO ENLARGE
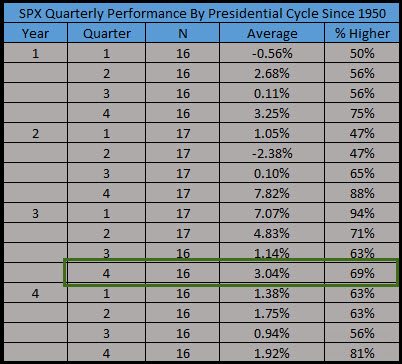
Breaking things down by the four-year Presidential cycle shows the upcoming quarter is up about three percent on average.
CLICK ON CHART TO ENLARGE
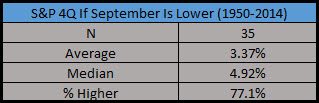
What about if September is lower? That happened in 2015 and again there is a nice bounce the rest of the year.
CLICK ON CHART TO ENLARGE
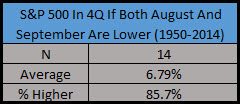
Even more rare is both August and September lower. This time we see extremely strong returns. In fact, the previous three times this happened were 2011, 2001, and 1999. The fourth quarter in those years returned a stellar 11%, 10%, and 14%.
CLICK ON CHART TO ENLARGE
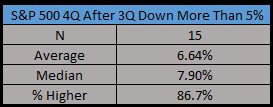
We saw a big drop in the third quarter this year (down about 9% with one day to go), what does that mean? Well, there have been 15 drops of more than 5% in the third quarter and the fourth quarter bounces back more than 6% on average.
CLICK ON CHART TO ENLARGE
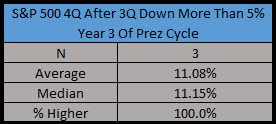
Things get even better during the third year of the Presidential cycle when the third quarter is down big. Up 11% on average would make a lot of people smile the last three months of the year.
CLICK ON CHART TO ENLARGE
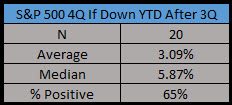
If the S&P 500 is down year-to-date after three quarters, the fourth quarter is up three percent on average with a six percent median return.
CLICK ON CHART TO ENLARGE
The bottom line is we are entering a historically bullish time frame, but do you just simply buy on the first day of the month? I’d say no.
CLICK ON CHART TO ENLARGE
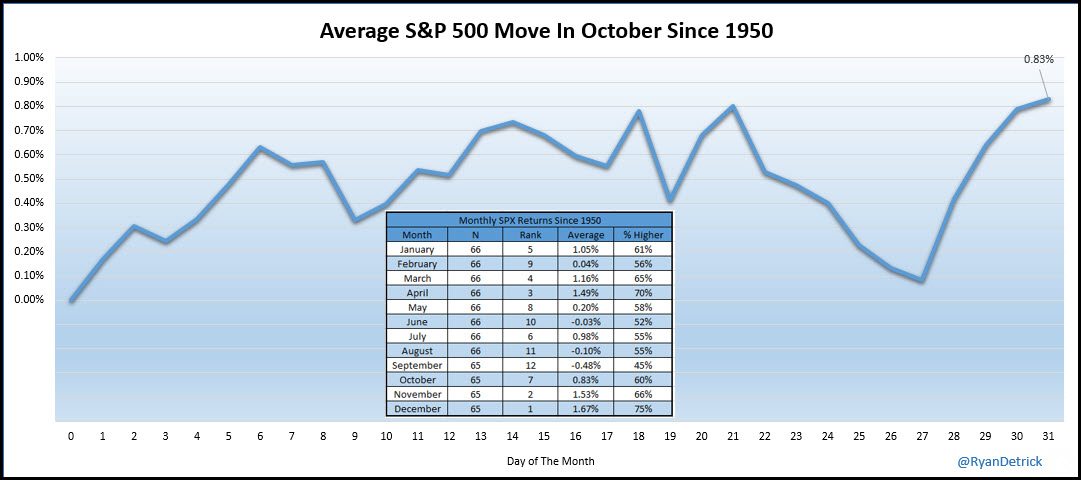
Looking at what the average October looks like, we tend to see a major low late in the month – then a very strong rally.
