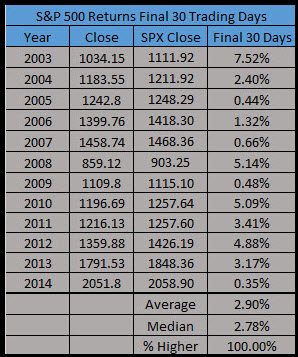
We are entering one of the most bullish times of the year historically. As we mentioned last week, the final 30 trading days of the year have been higher each of the last 12 years.
CLICK ON CHART TO ENLARGE
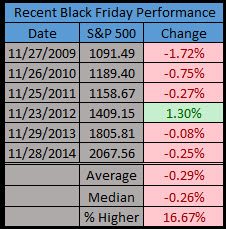
Getting to today, it is Black Friday – the official start to the holiday spending season. We’ve seen many stats that show this day isn’t quite as important as it once was. From many sales now starting on Thanksgiving, to Cyber Monday this coming Monday – there are other times people are looking for the best deals. None the less, today will get a lot of hype and we wanted to look to see if this day really mattered or not.
Recently, Black Friday has been rather weak – down five of the past six years.
CLICK ON CHART TO ENLARGE
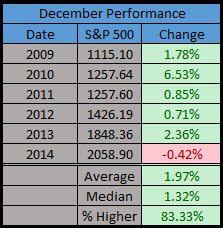
Did it matter the past six years? Did a weak Black Friday hurt what happened in December? Not so much, as five of the past six years were in the green.
CLICK ON CHART TO ENLARGE
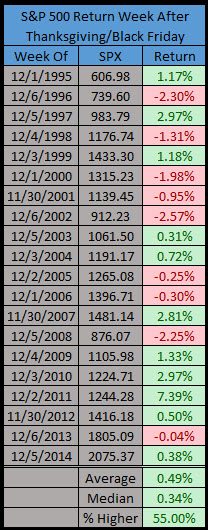
What about the week after Thanksgiving and Black Friday? Up six of the past seven years and up nearly half a percent on average going back 20 years.
CLICK ON CHART TO ENLARGE
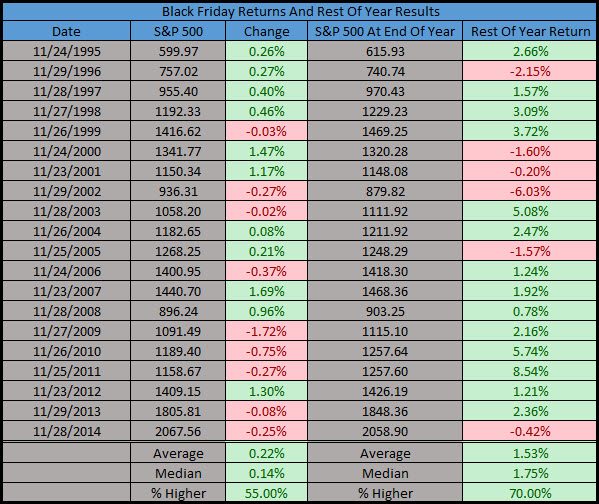
Here’s how all Black Fridays have done going back 20 years and the subsequent S&P 500 performance the rest of the year. The rest of the year is usually bullish. In fact, 10 of the past 12 years have sported a gain after Black Friday till the end of the year and eight of the past nine years.
CLICK ON CHART TO ENLARGE
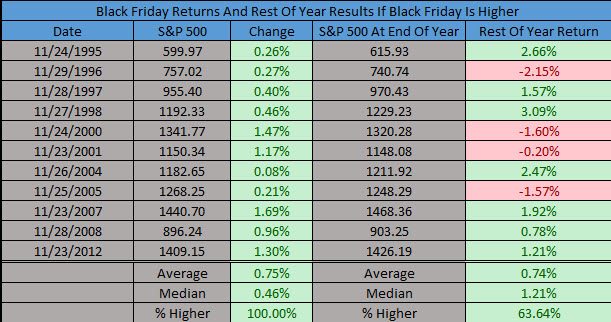
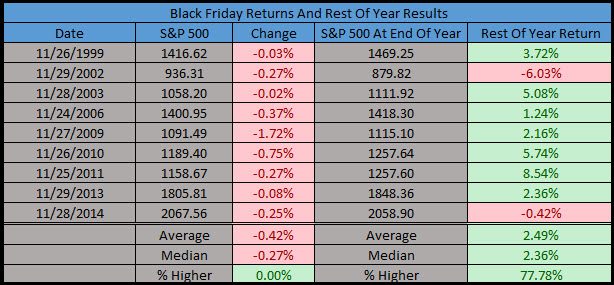
Lastly, does a good or bad Black Friday matter? Wouldn’t you know it, a red Black Friday bodes better for the rest of the year? In the end, when Black Friday is red, the rest of the year is higher by nearly a three-to-one margin and the median return is nearly twice as high.
CLICK ON CHART TO ENLARGE
CLICK ON CHART TO ENLARGE
The bottom line, Black Friday might get a lot of hype, but the end of the year is usually bullish and a lower move today could actually be a more bullish sign for future gains.
Today’s post by @Ryandetrick, head of statistical studies at Kimble Charting Solutions
–

