

We’ve been hearing over and over for months if not years, that the Fed was going to “push rates higher.”
Do billions of free thinking people have anything to do with where rates go from here? We think so!
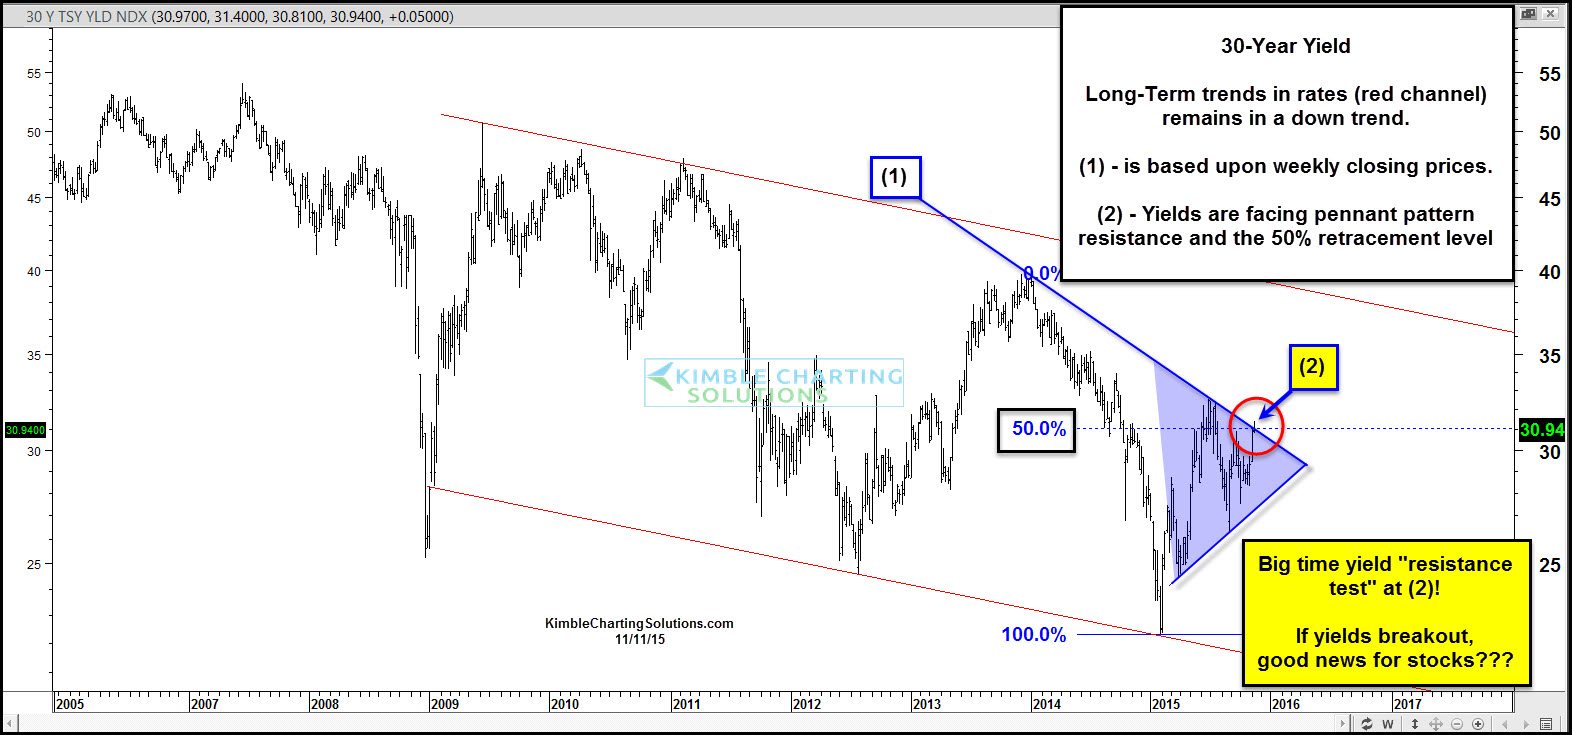
Below looks at the yield on the 30-year bond over the past decade.
CLICK ON CHART TO ENLARGE
Long-term yields when looking at them from 30,000 foot view, remain in a down trend (red channel). Yields now are near mid-level of this long-term channel.
The yield rally over the past few weeks has caused it to face falling resistance line (1), which looks to the part of a pennant pattern. At this time resistance remains resistance.
Yields find themselves at (2) today, which is at the top of the pennant pattern and at the 50% retracement level, based upon the yield high in 2014 and the low in Jan of this year.
What yields do at (2) should tell us a good deal about what billions of free thinking people are feeling.
If yields would breakout, would that be good for stocks? If yields hold at resistance, would that mean stocks are due a pause?
In my humble opinion, what rates do at (2), should have a good deal to say about where yields and stocks will be 5 to 6 months from now.
This is not your typical interest rate test of resistance!!!
Thank You Vets!!!

–
